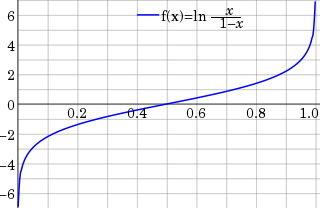
In statistics, the logit function is the quantile function associated with the standard logistic distribution. It has many uses in data analysis and machine learning, especially in data transformations.

In statistics, the logistic model is a statistical model that models the probability of an event taking place by having the log-odds for the event be a linear combination of one or more independent variables. In regression analysis, logistic regression is estimating the parameters of a logistic model. Formally, in binary logistic regression there is a single binary dependent variable, coded by an indicator variable, where the two values are labeled "0" and "1", while the independent variables can each be a binary variable or a continuous variable. The corresponding probability of the value labeled "1" can vary between 0 and 1, hence the labeling; the function that converts log-odds to probability is the logistic function, hence the name. The unit of measurement for the log-odds scale is called a logit, from logistic unit, hence the alternative names. See § Background and § Definition for formal mathematics, and § Example for a worked example.
Perceptual mapping or market mapping is a diagrammatic technique used by asset marketers that attempts to visually display the perceptions of customers or potential customers. The positioning of a brand is influenced by customer perceptions rather than by those of businesses. For example, a business may feel it sells upmarket products of high quality, but if customers view the products as low quality, it is their views which will influence sales. Typically the position of a company's product, product line, or brand is displayed relative to their competition. Perceptual maps, also known as market maps, usually have two dimensions but can be multi-dimensional or use multiple colours to add an extra variable. They can be used to identify gaps in the market and potential partners or merger targets as well as to clarify perceptual problems with a company's product. So, if a business wants to find out where its brand is positioned in the market, it might carry out market research. This will help them to find out how the customers sees their brand in relation to others in the market.

Intent scale translation is a mathematical technique used by marketers to convert stated purchase intentions into purchase probabilities, that is, into an estimate of actual buying behaviour. It takes survey data on consumers purchase intentions and converts it into actual purchase probabilities.
Preference-rank translation is a mathematical technique used by marketers to convert stated preferences into purchase probabilities, that is, into an estimate of actual buying behaviour. It takes survey data on consumers’ preferences and converts it into actual purchase probabilities.

Conjoint analysis is a survey-based statistical technique used in market research that helps determine how people value different attributes that make up an individual product or service.

Mathematical statistics is the application of probability theory, a branch of mathematics, to statistics, as opposed to techniques for collecting statistical data. Specific mathematical techniques which are used for this include mathematical analysis, linear algebra, stochastic analysis, differential equations, and measure theory.
The Profit Impact of Market Strategy (PIMS) program is a project that uses empirical data to try to determine which business strategies make the difference between success and failure. It is used to develop strategies for resource allocation and marketing. Some of the most important strategic metrics are market share, product quality, investment intensity and service quality. One of the emphasized principles is that the same factors work identically across different industries. The business management authors Tom Peters and Nancy Austin wrote that PIMS "yields solid evidence in support of both common sense and counter-intuitive principles for gaining and sustaining competitive advantage".
Linear discriminant analysis (LDA), normal discriminant analysis (NDA), or discriminant function analysis is a generalization of Fisher's linear discriminant, a method used in statistics and other fields, to find a linear combination of features that characterizes or separates two or more classes of objects or events. The resulting combination may be used as a linear classifier, or, more commonly, for dimensionality reduction before later classification.

In probability theory and statistics, the probit function is the quantile function associated with the standard normal distribution. It has applications in data analysis and machine learning, in particular exploratory statistical graphics and specialized regression modeling of binary response variables.
Customer satisfaction is a term frequently used in marketing. It is a measure of how products and services supplied by a company meet or surpass customer expectation. Customer satisfaction is defined as "the number of customers, or percentage of total customers, whose reported experience with a firm, its products, or its services (ratings) exceeds specified satisfaction goals." Customers play an important role and are essential in keeping a product or service relevant; it is, therefore, in the best interest of the business to ensure customer satisfaction and build customer loyalty.
In statistics, multinomial logistic regression is a classification method that generalizes logistic regression to multiclass problems, i.e. with more than two possible discrete outcomes. That is, it is a model that is used to predict the probabilities of the different possible outcomes of a categorically distributed dependent variable, given a set of independent variables.
In economics, discrete choice models, or qualitative choice models, describe, explain, and predict choices between two or more discrete alternatives, such as entering or not entering the labor market, or choosing between modes of transport. Such choices contrast with standard consumption models in which the quantity of each good consumed is assumed to be a continuous variable. In the continuous case, calculus methods can be used to determine the optimum amount chosen, and demand can be modeled empirically using regression analysis. On the other hand, discrete choice analysis examines situations in which the potential outcomes are discrete, such that the optimum is not characterized by standard first-order conditions. Thus, instead of examining "how much" as in problems with continuous choice variables, discrete choice analysis examines "which one". However, discrete choice analysis can also be used to examine the chosen quantity when only a few distinct quantities must be chosen from, such as the number of vehicles a household chooses to own and the number of minutes of telecommunications service a customer decides to purchase. Techniques such as logistic regression and probit regression can be used for empirical analysis of discrete choice.
In statistics, binomial regression is a regression analysis technique in which the response has a binomial distribution: it is the number of successes in a series of independent Bernoulli trials, where each trial has probability of success . In binomial regression, the probability of a success is related to explanatory variables: the corresponding concept in ordinary regression is to relate the mean value of the unobserved response to explanatory variables.
The following outline is provided as an overview of and topical guide to marketing:
Customer retention refers to the ability of a company or product to retain its customers over some specified period. High customer retention means customers of the product or business tend to return to, continue to buy or in some other way not defect to another product or business, or to non-use entirely. Selling organizations generally attempt to reduce customer defections. Customer retention starts with the first contact an organization has with a customer and continues throughout the entire lifetime of a relationship and successful retention efforts take this entire lifecycle into account. A company's ability to attract and retain new customers is related not only to its product or services, but also to the way it services its existing customers, the value the customers actually perceive as a result of utilizing the solutions, and the reputation it creates within and across the marketplace.
Choice modelling attempts to model the decision process of an individual or segment via revealed preferences or stated preferences made in a particular context or contexts. Typically, it attempts to use discrete choices in order to infer positions of the items on some relevant latent scale. Indeed many alternative models exist in econometrics, marketing, sociometrics and other fields, including utility maximization, optimization applied to consumer theory, and a plethora of other identification strategies which may be more or less accurate depending on the data, sample, hypothesis and the particular decision being modelled. In addition, choice modelling is regarded as the most suitable method for estimating consumers' willingness to pay for quality improvements in multiple dimensions.
In statistics, ridit scoring is a statistical method used to analyze ordered qualitative measurements. The tools of ridit analysis were developed and first applied by Bross, who coined the term "ridit" by analogy with other statistical transformations such as probit and logit. A ridit describes how the distribution of the dependent variable in row i of a contingency table compares relative to an identified distribution.
Ordinal data is a categorical, statistical data type where the variables have natural, ordered categories and the distances between the categories are not known. These data exist on an ordinal scale, one of four levels of measurement described by S. S. Stevens in 1946. The ordinal scale is distinguished from the nominal scale by having a ranking. It also differs from the interval scale and ratio scale by not having category widths that represent equal increments of the underlying attribute.