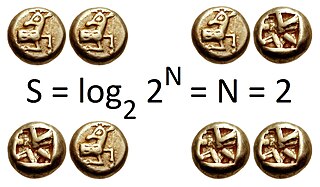
In information theory, the entropy of a random variable is the average level of "information", "surprise", or "uncertainty" inherent to the variable's possible outcomes. Given a discrete random variable , which takes values in the alphabet and is distributed according to :

Supervised learning (SL) is a machine learning paradigm for problems where the available data consists of labelled examples, meaning that each data point contains features (covariates) and an associated label. The goal of supervised learning algorithms is learning a function that maps feature vectors (inputs) to labels (output), based on example input-output pairs. It infers a function from labeled training data consisting of a set of training examples. In supervised learning, each example is a pair consisting of an input object and a desired output value. A supervised learning algorithm analyzes the training data and produces an inferred function, which can be used for mapping new examples. An optimal scenario will allow for the algorithm to correctly determine the class labels for unseen instances. This requires the learning algorithm to generalize from the training data to unseen situations in a "reasonable" way. This statistical quality of an algorithm is measured through the so-called generalization error.

In probability theory and statistics, a probability distribution is the mathematical function that gives the probabilities of occurrence of different possible outcomes for an experiment. It is a mathematical description of a random phenomenon in terms of its sample space and the probabilities of events.
A parameter, generally, is any characteristic that can help in defining or classifying a particular system. That is, a parameter is an element of a system that is useful, or critical, when identifying the system, or when evaluating its performance, status, condition, etc.
The likelihood function represents the probability of random variable realizations conditional on particular values of the statistical parameters. Thus, when evaluated on a given sample, the likelihood function indicates which parameter values are more likely than others, in the sense that they would have made the observed data more probable. Consequently, the likelihood is often written as instead of , to emphasize that it is to be understood as a function of the parameters instead of the random variable .
A hidden Markov model (HMM) is a statistical Markov model in which the system being modeled is assumed to be a Markov process — call it — with unobservable ("hidden") states. As part of the definition, HMM requires that there be an observable process whose outcomes are "influenced" by the outcomes of in a known way. Since cannot be observed directly, the goal is to learn about by observing HMM has an additional requirement that the outcome of at time must be "influenced" exclusively by the outcome of at and that the outcomes of and at must not affect the outcome of at

In probability and statistics, a Bernoulli process is a finite or infinite sequence of binary random variables, so it is a discrete-time stochastic process that takes only two values, canonically 0 and 1. The component Bernoulli variablesXi are identically distributed and independent. Prosaically, a Bernoulli process is a repeated coin flipping, possibly with an unfair coin. Every variable Xi in the sequence is associated with a Bernoulli trial or experiment. They all have the same Bernoulli distribution. Much of what can be said about the Bernoulli process can also be generalized to more than two outcomes ; this generalization is known as the Bernoulli scheme.
Pattern recognition is the automated recognition of patterns and regularities in data. It has applications in statistical data analysis, signal processing, image analysis, information retrieval, bioinformatics, data compression, computer graphics and machine learning. Pattern recognition has its origins in statistics and engineering; some modern approaches to pattern recognition include the use of machine learning, due to the increased availability of big data and a new abundance of processing power. These activities can be viewed as two facets of the same field of application, and they have undergone substantial development over the past few decades.

In statistics, the logistic model is a statistical model that models the probability of an event taking place by having the log-odds for the event be a linear combination of one or more independent variables. In regression analysis, logistic regression is estimating the parameters of a logistic model. Formally, in binary logistic regression there is a single binary dependent variable, coded by an indicator variable, where the two values are labeled "0" and "1", while the independent variables can each be a binary variable or a continuous variable. The corresponding probability of the value labeled "1" can vary between 0 and 1, hence the labeling; the function that converts log-odds to probability is the logistic function, hence the name. The unit of measurement for the log-odds scale is called a logit, from logistic unit, hence the alternative names. See § Background and § Definition for formal mathematics, and § Example for a worked example.
The posterior probability is a type of conditional probability that results from updating the prior probability with information summarized by the likelihood via an application of Bayes' rule. From an epistemological perspective, the posterior probability contains everything there is to know about an uncertain proposition, given prior knowledge and a mathematical model describing the observations available at a particular time. After the arrival of new information, the current posterior probability may serve as the prior in another round of Bayesian updating.
In statistics, a generalized linear model (GLM) is a flexible generalization of ordinary linear regression. The GLM generalizes linear regression by allowing the linear model to be related to the response variable via a link function and by allowing the magnitude of the variance of each measurement to be a function of its predicted value.

Given two random variables that are defined on the same probability space, the joint probability distribution is the corresponding probability distribution on all possible pairs of outputs. The joint distribution can just as well be considered for any given number of random variables. The joint distribution encodes the marginal distributions, i.e. the distributions of each of the individual random variables. It also encodes the conditional probability distributions, which deal with how the outputs of one random variable are distributed when given information on the outputs of the other random variable(s).

Statistical learning theory is a framework for machine learning drawing from the fields of statistics and functional analysis. Statistical learning theory deals with the statistical inference problem of finding a predictive function based on data. Statistical learning theory has led to successful applications in fields such as computer vision, speech recognition, and bioinformatics.

In probability theory and statistics, the continuous uniform distribution or rectangular distribution is a family of symmetric probability distributions. The distribution describes an experiment where there is an arbitrary outcome that lies between certain bounds. The bounds are defined by the parameters, a and b, which are the minimum and maximum values. The interval can either be closed or open. Therefore, the distribution is often abbreviated U, where U stands for uniform distribution. The difference between the bounds defines the interval length; all intervals of the same length on the distribution's support are equally probable. It is the maximum entropy probability distribution for a random variable X under no constraint other than that it is contained in the distribution's support.
Probability theory and statistics have some commonly used conventions, in addition to standard mathematical notation and mathematical symbols.
In metrology, measurement uncertainty is the expression of the statistical dispersion of the values attributed to a measured quantity. All measurements are subject to uncertainty and a measurement result is complete only when it is accompanied by a statement of the associated uncertainty, such as the standard deviation. By international agreement, this uncertainty has a probabilistic basis and reflects incomplete knowledge of the quantity value. It is a non-negative parameter.

The softmax function, also known as softargmax or normalized exponential function, converts a vector of K real numbers into a probability distribution of K possible outcomes. It is a generalization of the logistic function to multiple dimensions, and used in multinomial logistic regression. The softmax function is often used as the last activation function of a neural network to normalize the output of a network to a probability distribution over predicted output classes, based on Luce's choice axiom.
In statistics, censoring is a condition in which the value of a measurement or observation is only partially known.

In probability theory and statistics, the Poisson distribution is a discrete probability distribution that expresses the probability of a given number of events occurring in a fixed interval of time or space if these events occur with a known constant mean rate and independently of the time since the last event. It is named after French mathematician Siméon Denis Poisson. The Poisson distribution can also be used for the number of events in other specified interval types such as distance, area, or volume.

In machine learning, a probabilistic classifier is a classifier that is able to predict, given an observation of an input, a probability distribution over a set of classes, rather than only outputting the most likely class that the observation should belong to. Probabilistic classifiers provide classification that can be useful in its own right or when combining classifiers into ensembles.


