Statistics is a field of inquiry that studies the collection, analysis, interpretation, and presentation of data. It is applicable to a wide variety of academic disciplines, from the physical and social sciences to the humanities; it is also used and misused for making informed decisions in all areas of business and government.

Signal processing is a subfield of mathematics, information and electrical engineering that concerns the analysis, synthesis, and modification of signals, which are broadly defined as functions conveying "information about the behavior or attributes of some phenomenon", such as sound, images, and biological measurements. For example, signal processing techniques are used to improve signal transmission fidelity, storage efficiency, and subjective quality, and to emphasize or detect components of interest in a measured signal.
Forecasting is the process of making predictions of the future based on past and present data and most commonly by analysis of trends. A commonplace example might be estimation of some variable of interest at some specified future date. Prediction is a similar, but more general term. Both might refer to formal statistical methods employing time series, cross-sectional or longitudinal data, or alternatively to less formal judgmental methods. Usage can differ between areas of application: for example, in hydrology the terms "forecast" and "forecasting" are sometimes reserved for estimates of values at certain specific future times, while the term "prediction" is used for more general estimates, such as the number of times floods will occur over a long period.

A time series is a series of data points indexed in time order. Most commonly, a time series is a sequence taken at successive equally spaced points in time. Thus it is a sequence of discrete-time data. Examples of time series are heights of ocean tides, counts of sunspots, and the daily closing value of the Dow Jones Industrial Average.
Linear trend estimation is a statistical technique to aid interpretation of data. When a series of measurements of a process are treated as a time series, trend estimation can be used to make and justify statements about tendencies in the data, by relating the measurements to the times at which they occurred. This model can then be used to describe the behaviour of the observed data, without explaining it. Linear trend estimation expresses data as a linear function of time, and can also be used to determine the significance of differences in a set of data linked by a categorical factor. An example of the latter from biomedical science would be levels of a molecule in the blood or tissues of patients with incrementally worsening disease - such as mild, moderate and severe.. This is in contrast to an ANOVA, which is reserved for three or more independent groups.
In the statistical analysis of time series, autoregressive–moving-average (ARMA) models provide a parsimonious description of a (weakly) stationary stochastic process in terms of two polynomials, one for the autoregression (AR) and the second for the moving average (MA). The general ARMA model was described in the 1951 thesis of Peter Whittle, Hypothesis testing in time series analysis, and it was popularized in the 1970 book by George E. P. Box and Gwilym Jenkins.
The Hodrick–Prescott filter is a mathematical tool used in macroeconomics, especially in real business cycle theory, to remove the cyclical component of a time series from raw data. It is used to obtain a smoothed-curve representation of a time series, one that is more sensitive to long-term than to short-term fluctuations. The adjustment of the sensitivity of the trend to short-term fluctuations is achieved by modifying a multiplier
. The filter was popularized in the field of economics in the 1990s by economists Robert J. Hodrick and Nobel Memorial Prize winner Edward C. Prescott. However, it was first proposed much earlier by E. T. Whittaker in 1923.

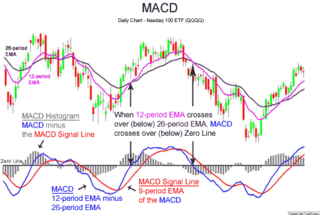
MACD, short for moving average convergence/divergence, is a trading indicator used in technical analysis of stock prices, created by Gerald Appel in the late 1970s. It is designed to reveal changes in the strength, direction, momentum, and duration of a trend in a stock's price.
In statistics, econometrics and signal processing, an autoregressive (AR) model is a representation of a type of random process; as such, it is used to describe certain time-varying processes in nature, economics, etc. The autoregressive model specifies that the output variable depends linearly on its own previous values and on a stochastic term ; thus the model is in the form of a stochastic difference equation. In machine learning, an autoregressive model learns from a series of timed steps and takes measurements from previous actions as inputs for a regression model, in order to predict the value of the next time step.
In statistics and econometrics, and in particular in time series analysis, an autoregressive integrated moving average (ARIMA) model is a generalization of an autoregressive moving average (ARMA) model. Both of these models are fitted to time series data either to better understand the data or to predict future points in the series (forecasting). ARIMA models are applied in some cases where data show evidence of non-stationarity, where an initial differencing step can be applied one or more times to eliminate the non-stationarity.
Exponential smoothing is a rule of thumb technique for smoothing time series data using the exponential window function. Whereas in the simple moving average the past observations are weighted equally, exponential functions are used to assign exponentially decreasing weights over time. It is an easily learned and easily applied procedure for making some determination based on prior assumptions by the user, such as seasonality. Exponential smoothing is often used for analysis of time-series data.
Video tracking is the process of locating a moving object over time using a camera. It has a variety of uses, some of which are: human-computer interaction, security and surveillance, video communication and compression, augmented reality, traffic control, medical imaging and video editing. Video tracking can be a time consuming process due to the amount of data that is contained in video. Adding further to the complexity is the possible need to use object recognition techniques for tracking, a challenging problem in its own right.
In time series analysis, the Box–Jenkins method, named after the statisticians George Box and Gwilym Jenkins, applies autoregressive moving average (ARMA) or autoregressive integrated moving average (ARIMA) models to find the best fit of a time-series model to past values of a time series.
In statistics and image processing, to smooth a data set is to create an approximating function that attempts to capture important patterns in the data, while leaving out noise or other fine-scale structures/rapid phenomena. In smoothing, the data points of a signal are modified so individual points are reduced, and points that are lower than the adjacent points are increased leading to a smoother signal. Smoothing may be used in two important ways that can aid in data analysis (1) by being able to extract more information from the data as long as the assumption of smoothing is reasonable and (2) by being able to provide analyses that are both flexible and robust. Many different algorithms are used in smoothing.
In statistics, Wold's decomposition or the Wold representation theorem, named after Herman Wold, says that every covariance-stationary time series
can be written as the sum of two time series, one deterministic and one stochastic.
RATS, an abbreviation of Regression Analysis of Time Series, is a statistical package for time series analysis and econometrics. RATS is developed and sold by Estima, Inc., located in Evanston, IL.
In time series data, seasonality is the presence of variations that occur at specific regular intervals less than a year, such as weekly, monthly, or quarterly. Seasonality may be caused by various factors, such as weather, vacation, and holidays and consists of periodic, repetitive, and generally regular and predictable patterns in the levels of a time series.

Numerical Analysis for Excel (NumXL) is an econometrics and time series analysis add-in for Microsoft Excel. Developed by Spider Financial, NumXL provides a wide variety of statistical and time series analysis techniques, including linear and nonlinear time series modeling, statistical tests and others.


