In finance, technical analysis is an analysis methodology for analysing and forecasting the direction of prices through the study of past market data, primarily price and volume. As a type of active management, it stands in contradiction to much of modern portfolio theory. The efficacy of technical analysis is disputed by the efficient-market hypothesis, which states that stock market prices are essentially unpredictable, and research on whether technical analysis offers any benefit has produced mixed results. It is distinguished from fundamental analysis, which considers a company's financial statements, health, and the overall state of the market and economy.
The relative strength index (RSI) is a technical indicator used in the analysis of financial markets. It is intended to chart the current and historical strength or weakness of a stock or market based on the closing prices of a recent trading period. The indicator should not be confused with relative strength.
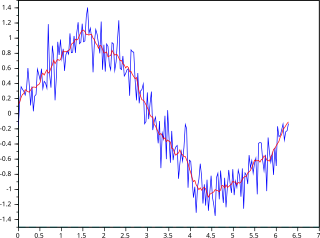
In statistics, a moving average is a calculation to analyze data points by creating a series of averages of different selections of the full data set. Variations include: simple, cumulative, or weighted forms.
In stock and securities market technical analysis, parabolic SAR is a method devised by J. Welles Wilder Jr., to find potential reversals in the market price direction of traded goods such as securities or currency exchanges such as forex. It is a trend-following (lagging) indicator and may be used to set a trailing stop loss or determine entry or exit points based on prices tending to stay within a parabolic curve during a strong trend.

MACD, short for moving average convergence/divergence, is a trading indicator used in technical analysis of securities prices, created by Gerald Appel in the late 1970s. It is designed to reveal changes in the strength, direction, momentum, and duration of a trend in a stock's price.
In financial technical analysis, momentum (MTM) and rate of change (ROC) are simple indicators showing the difference between today's closing price and the close N days ago. Momentum is the absolute difference in stock, commodity:
Exponential smoothing or exponential moving average (EMA) is a rule of thumb technique for smoothing time series data using the exponential window function. Whereas in the simple moving average the past observations are weighted equally, exponential functions are used to assign exponentially decreasing weights over time. It is an easily learned and easily applied procedure for making some determination based on prior assumptions by the user, such as seasonality. Exponential smoothing is often used for analysis of time-series data.
The commodity channel index (CCI) is an oscillator originally introduced by Donald Lambert in 1980.
Average true range (ATR) is a technical analysis volatility indicator originally developed by J. Welles Wilder, Jr. for commodities. The indicator does not provide an indication of price trend, simply the degree of price volatility. The average true range is an N-period smoothed moving average (SMMA) of the true range values. Wilder recommended a 14-period smoothing.

The detrended price oscillator (DPO) is an indicator in technical analysis that attempts to eliminate the long-term trends in prices by using a displaced moving average so it does not react to the most current price action. This allows the indicator to show intermediate overbought and oversold levels effectively.
The mass index is an indicator, developed by Donald Dorsey, used in technical analysis to predict trend reversals. It is based on the notion that there is a tendency for reversal when the price range widens, and therefore compares previous trading ranges.
In technical analysis of securities trading, the stochastic oscillator is a momentum indicator that uses support and resistance levels. George Lane developed this indicator in the late 1950s. The term stochastic refers to the point of a current price in relation to its price range over a period of time. This method attempts to predict price turning points by comparing the closing price of a security to its price range.
The average directional movement index (ADX) was developed in 1978 by J. Welles Wilder as an indicator of trend strength in a series of prices of a financial instrument. ADX has become a widely used indicator for technical analysts, and is provided as a standard in collections of indicators offered by various trading platforms.
On the technical analysis chart, a wedge pattern is a market trend commonly found in traded assets. The pattern is characterized by a contracting range in prices coupled with an upward trend in prices or a downward trend in prices.
The doji is a commonly found pattern in a candlestick chart of financially traded assets in technical analysis. It is characterized by being small in length—meaning a small trading range—with an opening and closing price that are virtually equal. The efficacy of technical analysis is disputed by the efficient-market hypothesis, which states that stock market prices are essentially unpredictable.
In financial technical analysis, the know sure thing (KST) oscillator is a complex, smoothed price velocity indicator developed by Martin J. Pring.
The true strength index (TSI) is a technical indicator used in the analysis of financial markets that attempts to show both trend direction and overbought/oversold conditions. It was first published William Blau in 1991. The indicator uses moving averages of the underlying momentum of a financial instrument. Momentum is considered a leading indicator of price movements, and a moving average characteristically lags behind price. The TSI combines these characteristics to create an indication of price and direction more in sync with market turns than either momentum or moving average. The TSI is provided as part of the standard collection of indicators offered by various trading platforms.

Chaikin Analytics is a platform for stock trading ideas. It was founded in 2011 by Marc Chaikin. The centerpiece of Chaikin Analytics is the Chaikin Power Gauge stock rating. In 2016, it was named one of "Two Top Websites for Quantitative Analysis" by Barron's (newspaper).
The Triple Exponential Moving Average (TEMA) indicator was introduced in January 1994 by Patrick G. Mulloy, in an article in the Technical Analysis of Stocks & Commodities magazine: "Smoothing Data with Faster Moving Averages"
The Double Exponential Moving Average (DEMA) indicator was introduced in January 1994 by Patrick G. Mulloy, in an article in the "Technical Analysis of Stocks & Commodities" magazine: "Smoothing Data with Faster Moving Averages"


