A market trend is a perceived tendency of the financial markets to move in a particular direction over time. Analysts classify these trends as secular for long time-frames, primary for medium time-frames, and secondary for short time-frames. Traders attempt to identify market trends using technical analysis, a framework which characterizes market trends as predictable price tendencies within the market when price reaches support and resistance levels, varying over time.
In finance, technical analysis is an analysis methodology for analysing and forecasting the direction of prices through the study of past market data, primarily price and volume. As a type of active management, it stands in contradiction to much of modern portfolio theory. The efficacy of technical analysis is disputed by the efficient-market hypothesis, which states that stock market prices are essentially unpredictable, and research on whether technical analysis offers any benefit has produced mixed results. It is distinguished from fundamental analysis, which considers a company's financial statements, health, and the overall state of the market and economy.
The relative strength index (RSI) is a technical indicator used in the analysis of financial markets. It is intended to chart the current and historical strength or weakness of a stock or market based on the closing prices of a recent trading period. The indicator should not be confused with relative strength.
In stock market technical analysis, support and resistance are certain predetermined levels of the price of a security at which it is thought that the price will tend to stop and reverse. These levels are denoted by multiple touches of price without a breakthrough of the level.
In stock and securities market technical analysis, parabolic SAR is a method devised by J. Welles Wilder Jr., to find potential reversals in the market price direction of traded goods such as securities or currency exchanges such as forex. It is a trend-following (lagging) indicator and may be used to set a trailing stop loss or determine entry or exit points based on prices tending to stay within a parabolic curve during a strong trend.

MACD, short for moving average convergence/divergence, is a trading indicator used in technical analysis of securities prices, created by Gerald Appel in the late 1970s. It is designed to reveal changes in the strength, direction, momentum, and duration of a trend in a stock's price.
Point and figure (P&F) is a charting technique used in technical analysis. Point and figure charting does not plot price against time as time-based charts do. Instead it plots price against changes in direction by plotting a column of Xs as the price rises and a column of Os as the price falls.

Bollinger Bands are a type of statistical chart characterizing the prices and volatility over time of a financial instrument or commodity, using a formulaic method propounded by John Bollinger in the 1980s. Financial traders employ these charts as a methodical tool to inform trading decisions, control automated trading systems, or as a component of technical analysis. Bollinger Bands display a graphical band and volatility in one two-dimensional chart.
A chart pattern or price pattern is a pattern within a chart when prices are graphed. In stock and commodity markets trading, chart pattern studies play a large role during technical analysis. When data is plotted there is usually a pattern which naturally occurs and repeats over a period. Chart patterns are used as either reversal or continuation signals.
The commodity channel index (CCI) is an oscillator originally introduced by Donald Lambert in 1980.
In finance, a trend line is a bounding line for the price movement of a security. It is formed when a diagonal line can be drawn between a minimum of three or more price pivot points. A line can be drawn between any two points, but it does not qualify as a trend line until tested. Hence the need for the third point, the test. Trend lines are commonly used to decide entry and exit timing when trading securities. They can also be referred to as a Dutch line, as the concept was first used in Holland.
Trend following or trend trading is a trading strategy according to which one should buy an asset when its price trend goes up, and sell when its trend goes down, expecting price movements to continue.
In technical analysis in finance, a technical indicator is a mathematical calculation based on historic price, volume, or open interest information that aims to forecast financial market direction. Technical indicators are a fundamental part of technical analysis and are typically plotted as a chart pattern to try to predict the market trend. Indicators generally overlay on price chart data to indicate where the price is going, or whether the price is in an "overbought" condition or an "oversold" condition.

4Music is a British music television channel owned and operated by Channel Four Television Corporation that launched on 15 August 2008.
On the technical analysis chart, the head and shoulders formation occurs when a market trend is in the process of reversal either from a bullish or bearish trend; a characteristic pattern takes shape and is recognized as reversal formation.
On the technical analysis chart, a wedge pattern is a market trend commonly found in traded assets. The pattern is characterized by a contracting range in prices coupled with an upward trend in prices or a downward trend in prices.
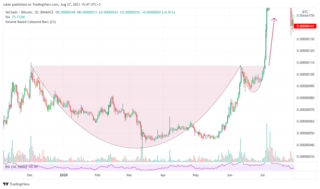
In the domain of technical analysis of market prices, a cup and handle or cup with handle formation is a chart pattern consisting of a drop in the price and a rise back up to the original value, followed first by a smaller drop and then a rise past the previous peak. It is interpreted as an indication of bullish sentiment in the market and possible further price increases.

Ichimoku Kinko Hyo (IKH) (Japanese: 一目均衡表, Hepburn: Ichimoku Kinkō Hyō), usually shortened to "Ichimoku", is a technical analysis method that builds on candlestick charting to improve the accuracy of forecast price moves.
Price action is a method of analysis of the basic price movements to generate trade entry and exit signals that is considered reliable while not requiring the use of indicators. It is a form of technical analysis, as it ignores the fundamental factors of a security and looks primarily at the security's price history. However, this method is different from other forms of technical analysis, as it focuses on the relation of the security's current price to its price history, which consists of all price movements, as opposed to values derived from the price history.

In finance, MIDAS is an approach to technical analysis initiated in 1995 by the physicist and technical analyst Paul Levine, PhD, and subsequently developed by Andrew Coles, PhD, and David Hawkins in a series of articles and the book MIDAS Technical Analysis: A VWAP Approach to Trading and Investing in Today's Markets. Latterly, several important contributions to the project, including new MIDAS curves and indicators, have been made by Bob English, many of them published in the book.
