In finance, technical analysis is an analysis methodology for analysing and forecasting the direction of prices through the study of past market data, primarily price and volume. As a type of active management, it stands in contradiction to much of modern portfolio theory. The efficacy of technical analysis is disputed by the efficient-market hypothesis, which states that stock market prices are essentially unpredictable, and research on whether technical analysis offers any benefit has produced mixed results. It is distinguished from fundamental analysis, which considers a company's financial statements, health, and the overall state of the market and economy.
The relative strength index (RSI) is a technical indicator used in the analysis of financial markets. It is intended to chart the current and historical strength or weakness of a stock or market based on the closing prices of a recent trading period. The indicator should not be confused with relative strength.
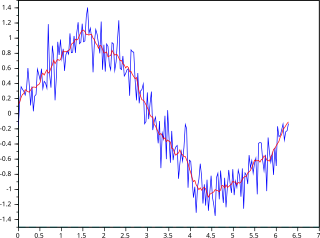
In statistics, a moving average is a calculation to analyze data points by creating a series of averages of different selections of the full data set. Variations include: simple, cumulative, or weighted forms.

MACD, short for moving average convergence/divergence, is a trading indicator used in technical analysis of securities prices, created by Gerald Appel in the late 1970s. It is designed to reveal changes in the strength, direction, momentum, and duration of a trend in a stock's price.
X-13ARIMA-SEATS, successor to X-12-ARIMA and X-11, is a set of statistical methods for seasonal adjustment and other descriptive analysis of time series data that are implemented in the U.S. Census Bureau's software package. These methods are or have been used by Statistics Canada, Australian Bureau of Statistics, and the statistical offices of many other countries.
Equity risk is "the financial risk involved in holding equity in a particular investment." Equity risk is a type of market risk that applies to investing in shares. The market price of stocks fluctuates all the time, depending on supply and demand. The risk of losing money due to a reduction in the market price of shares is known as equity risk.
In financial technical analysis, momentum (MTM) and rate of change (ROC) are simple indicators showing the difference between today's closing price and the close N days ago. Momentum is the absolute difference in stock, commodity:

The Donchian channel is an indicator used in market trading developed by Richard Donchian. It is formed by taking the highest high and the lowest low of the last n periods. The area between the high and the low is the channel for the period chosen.
The commodity channel index (CCI) is an oscillator indicator that is used by traders and investors to help identify price reversals, price extremes and trend strength when using technical analysis to analyse financial markets.
The accumulation/distribution line or accumulation/distribution index in the stock market, is a technical analysis indicator intended to relate price and volume, which supposedly acts as a leading indicator of price movements. It provides a measure of the commitment of bulls and bears to the market and is used to detect divergences between volume and price action - signs that a trend is weakening.
Average true range (ATR) is a technical analysis volatility indicator originally developed by J. Welles Wilder, Jr. for commodities. The indicator does not provide an indication of price trend, simply the degree of price volatility. The average true range is an N-period smoothed moving average (SMMA) of the true range values. Wilder recommended a 14-period smoothing.
Ease of movement (EMV) is an indicator used in technical analysis to relate an asset's price change to its volume. Ease of Movement was developed by Richard W. Arms, Jr. and highlights the relationship between volume and price changes and is particularly useful for assessing the strength of a trend. High positive values indicate the price is increasing on low volume: strong negative values indicate the price is dropping on low volume. The moving average of the indicator can be added to act as a trigger line, which is similar to other indicators like the MACD.

In financial markets, a pivot point is a price level that is used by traders as a possible indicator of market movement. A pivot point is calculated as an average of significant prices from the performance of a market in the prior trading period. If the market in the following period trades above the pivot point it is usually evaluated as a bullish sentiment, whereas trading below the pivot point is seen as bearish.
Stochastic oscillator is a momentum indicator within technical analysis that uses support and resistance levels as an oscillator. George Lane developed this indicator in the late 1950s. The term stochastic refers to the point of a current price in relation to its price range over a period of time. This method attempts to predict price turning points by comparing the closing price of a security to its price range.
The average directional movement index (ADX) was developed in 1978 by J. Welles Wilder as an indicator of trend strength in a series of prices of a financial instrument. ADX has become a widely used indicator for technical analysts, and is provided as a standard in collections of indicators offered by various trading platforms.
In financial technical analysis, the know sure thing (KST) oscillator is a complex, smoothed price velocity indicator developed by Martin J. Pring.
The true strength index (TSI) is a technical indicator used in the analysis of financial markets that attempts to show both trend direction and overbought/oversold conditions. It was first published William Blau in 1991. The indicator uses moving averages of the underlying momentum of a financial instrument. Momentum is considered a leading indicator of price movements, and a moving average characteristically lags behind price. The TSI combines these characteristics to create an indication of price and direction more in sync with market turns than either momentum or moving average. The TSI is provided as part of the standard collection of indicators offered by various trading platforms.
The zero lag exponential moving average (ZLEMA) is a technical indicator within technical analysis that aims is to eliminate the inherent lag associated to all trend following indicators which average a price over time. As is the case with the double exponential moving average (DEMA) and the triple exponential moving average (TEMA) this indicator aims to reduce the lag.

In finance, MIDAS is an approach to technical analysis initiated in 1995 by the physicist and technical analyst Paul Levine, PhD, and subsequently developed by Andrew Coles, PhD, and David Hawkins in a series of articles and the book MIDAS Technical Analysis: A VWAP Approach to Trading and Investing in Today's Markets. Latterly, several important contributions to the project, including new MIDAS curves and indicators, have been made by Bob English, many of them published in the book.

Volume Analysis is an example of a type of technical analysis that examines the volume of traded securities to confirm and predict price trends. Volume is a measure of the number of shares of an asset that are traded in a given period of time. As one of the oldest market indicators used for analysis, sudden changes in volume are often the result of news-related events. Commonly used by chartists and technical analysts, volume analysis is centered on the following ideas:

