In statistics, the standard deviation is a measure of the amount of variation of the values of a variable about its mean. A low standard deviation indicates that the values tend to be close to the mean of the set, while a high standard deviation indicates that the values are spread out over a wider range. The standard deviation is commonly used in the determination of what constitutes an outlier and what does not.

In probability theory and statistics, variance is the expected value of the squared deviation from the mean of a random variable. The standard deviation (SD) is obtained as the square root of the variance. Variance is a measure of dispersion, meaning it is a measure of how far a set of numbers is spread out from their average value. It is the second central moment of a distribution, and the covariance of the random variable with itself, and it is often represented by , , , , or .
Internal rate of return (IRR) is a method of calculating an investment's rate of return. The term internal refers to the fact that the calculation excludes external factors, such as the risk-free rate, inflation, the cost of capital, or financial risk.
In finance, the style or family of an option is the class into which the option falls, usually defined by the dates on which the option may be exercised. The vast majority of options are either European or American (style) options. These options—as well as others where the payoff is calculated similarly—are referred to as "vanilla options". Options where the payoff is calculated differently are categorized as "exotic options". Exotic options can pose challenging problems in valuation and hedging.
In finance, the binomial options pricing model (BOPM) provides a generalizable numerical method for the valuation of options. Essentially, the model uses a "discrete-time" model of the varying price over time of the underlying financial instrument, addressing cases where the closed-form Black–Scholes formula is wanting.
In mathematical finance, the Greeks are the quantities representing the sensitivity of the price of a derivative instrument such as an option to changes in one or more underlying parameters on which the value of an instrument or portfolio of financial instruments is dependent. The name is used because the most common of these sensitivities are denoted by Greek letters. Collectively these have also been called the risk sensitivities, risk measures or hedge parameters.
The relative strength index (RSI) is a technical indicator used in the analysis of financial markets. It is intended to chart the current and historical strength or weakness of a stock or market based on the closing prices of a recent trading period. The indicator should not be confused with relative strength.
In finance, the beta is a statistic that measures the expected increase or decrease of an individual stock price in proportion to movements of the stock market as a whole. Beta can be used to indicate the contribution of an individual asset to the market risk of a portfolio when it is added in small quantity. It refers to an asset's non-diversifiable risk, systematic risk, or market risk. Beta is not a measure of idiosyncratic risk.

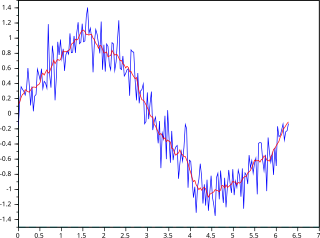
In statistics, a moving average is a calculation to analyze data points by creating a series of averages of different selections of the full data set. Variations include: simple, cumulative, or weighted forms.

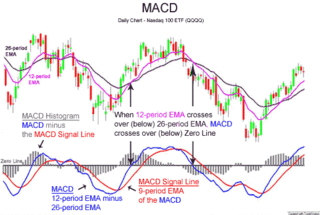
MACD, short for moving average convergence/divergence, is a trading indicator used in technical analysis of securities prices, created by Gerald Appel in the late 1970s. It is designed to reveal changes in the strength, direction, momentum, and duration of a trend in a stock's price.

Volatility smiles are implied volatility patterns that arise in pricing financial options. It is a parameter that is needed to be modified for the Black–Scholes formula to fit market prices. In particular for a given expiration, options whose strike price differs substantially from the underlying asset's price command higher prices than what is suggested by standard option pricing models. These options are said to be either deep in-the-money or out-of-the-money.
A variance swap is an over-the-counter financial derivative that allows one to speculate on or hedge risks associated with the magnitude of movement, i.e. volatility, of some underlying product, like an exchange rate, interest rate, or stock index.

Bollinger Bands are a type of statistical chart characterizing the prices and volatility over time of a financial instrument or commodity, using a formulaic method propounded by John Bollinger in the 1980s. Financial traders employ these charts as a methodical tool to inform trading decisions, control automated trading systems, or as a component of technical analysis. Bollinger Bands display a graphical band and volatility in one two-dimensional chart.
In finance, margin is the collateral that a holder of a financial instrument has to deposit with a counterparty to cover some or all of the credit risk the holder poses for the counterparty. This risk can arise if the holder has done any of the following:

The ultimate oscillator is a theoretical concept in finance developed by Larry Williams as a way to account for the problems experienced in most oscillators when used over different lengths of time.
The backspread is the converse strategy to the ratio spread and is also known as reverse ratio spread. Using calls, a bullish strategy known as the call backspread can be constructed and with puts, a strategy known as the put backspread can be constructed.
Stochastic oscillator is a momentum indicator within technical analysis that uses support and resistance levels as an oscillator. George Lane developed this indicator in the late 1950s. The term stochastic refers to the point of a current price in relation to its price range over a period of time. This method attempts to predict price turning points by comparing the closing price of a security to its price range.

In finance, volatility is the degree of variation of a trading price series over time, usually measured by the standard deviation of logarithmic returns.

IVX is a volatility index providing an intraday, VIX-like measure for any of US securities and exchange traded instruments. IVX is the abbreviation of Implied Volatility Index and is a popular measure of the implied volatility of each individual stock. IVX represents the cost level of the options for a particular security and comparing to its historical levels one can see whether IVX is high or low and thus whether options are more expensive or cheaper. IVX values can be compared for the stocks within one industry to find names which significantly differ from what is observed in overall sector.
The Vortex Indicator is a technical indicator invented by Etienne Botes and Douglas Siepman to identify the start of a new trend or the continuation of an existing trend within financial markets. It was published in the January 2010 edition of Technical Analysis of Stocks & Commodities.


