A market trend is a perceived tendency of the financial markets to move in a particular direction over time. Analysts classify these trends as secular for long time-frames, primary for medium time-frames, and secondary for short time-frames. Traders attempt to identify market trends using technical analysis, a framework which characterizes market trends as predictable price tendencies within the market when price reaches support and resistance levels, varying over time.
Investment is traditionally defined as the "commitment of resources to achieve later benefits". If an investment involves money, then it can be defined as a "commitment of money to receive more money later". From a broader viewpoint, an investment can be defined as "to tailor the pattern of expenditure and receipt of resources to optimise the desirable patterns of these flows". When expenditures and receipts are defined in terms of money, then the net monetary receipt in a time period is termed cash flow, while money received in a series of several time periods is termed cash flow stream.

The price–earnings ratio, also known as P/E ratio, P/E, or PER, is the ratio of a company's share (stock) price to the company's earnings per share. The ratio is used for valuing companies and to find out whether they are overvalued or undervalued.
The Dow theory on stock price movement is a form of technical analysis that includes some aspects of sector rotation. The theory was derived from 255 editorials in The Wall Street Journal written by Charles H. Dow (1851–1902), journalist, founder and first editor of The Wall Street Journal and co-founder of Dow Jones and Company. Following Dow's death, William Peter Hamilton, Robert Rhea and E. George Schaefer organized and collectively represented Dow theory, based on Dow's editorials. Dow himself never used the term Dow theory nor presented it as a trading system.
The relative strength index (RSI) is a technical indicator used in the analysis of financial markets. It is intended to chart the current and historical strength or weakness of a stock or market based on the closing prices of a recent trading period. The indicator should not be confused with relative strength.

MACD, short for moving average convergence/divergence, is a trading indicator used in technical analysis of securities prices, created by Gerald Appel in the late 1970s. It is designed to reveal changes in the strength, direction, momentum, and duration of a trend in a stock's price.

Bollinger Bands are a type of statistical chart characterizing the prices and volatility over time of a financial instrument or commodity, using a formulaic method propounded by John Bollinger in the 1980s. Financial traders employ these charts as a methodical tool to inform trading decisions, control automated trading systems, or as a component of technical analysis. Bollinger Bands display a graphical band and volatility in one two-dimensional chart.
In financial technical analysis, momentum (MTM) and rate of change (ROC) are simple indicators showing the difference between today's closing price and the close N days ago. Momentum is the absolute difference in stock, commodity:
In finance, an investment strategy is a set of rules, behaviors or procedures, designed to guide an investor's selection of an investment portfolio. Individuals have different profit objectives, and their individual skills make different tactics and strategies appropriate. Some choices involve a tradeoff between risk and return. Most investors fall somewhere in between, accepting some risk for the expectation of higher returns.
The commodity channel index (CCI) is an oscillator indicator that is used by traders and investors to help identify price reversals, price extremes and trend strength when using technical analysis to analyse financial markets.
In finance, return is a profit on an investment. It comprises any change in value of the investment, and/or cash flows which the investor receives from that investment over a specified time period, such as interest payments, coupons, cash dividends and stock dividends. It may be measured either in absolute terms or as a percentage of the amount invested. The latter is also called the holding period return.
The Negative Volume Index and Positive Volume Index are indicators to identify primary market trends and reversals when using technical analysis to study financial markets.
Trend following or trend trading is a trading strategy according to which one should buy an asset when its price trend goes up, and sell when its trend goes down, expecting price movements to continue.

PFTS index is a benchmark index of PFTS Ukraine Stock Exchange, Ukraine's leading bourse. Beside PFTS Index, there are also the UX Index of the Ukrainian Exchange and the Ukrainian Average Index 50 (UAI-50) being composed by analysts of internet-publisher fundmarket.ua.
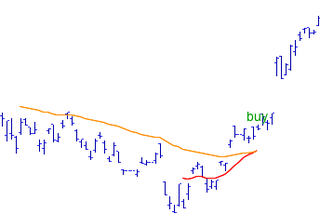
In the statistics of time series, and in particular the stock market technical analysis, a moving-average crossover occurs when, on plotting two moving averages each based on different degrees of smoothing, the traces of these moving averages cross. It does not predict future direction but shows trends. This indicator uses two moving averages, a slower moving average and a faster moving average. The faster moving average is a short term moving average. For end-of-day stock markets, for example, it may be 5-, 10- or 25-day period while the slower moving average is medium or long term moving average. A short term moving average is faster because it only considers prices over short period of time and is thus more reactive to daily price changes. On the other hand, a long term moving average is deemed slower as it encapsulates prices over a longer period and is more lethargic. However, it tends to smooth out price noises which are often reflected in short term moving averages.
Return on investment (ROI) or return on costs (ROC) is the ratio between net income and investment. A high ROI means the investment's gains compare favourably to its cost. As a performance measure, ROI is used to evaluate the efficiency of an investment or to compare the efficiencies of several different investments. In economic terms, it is one way of relating profits to capital invested.
In capital markets, volume, or trading volume, is the amount of a security that was traded during a given period of time. In the context of a single stock trading on a stock exchange, the volume is commonly reported as the number of shares that changed hands during a given day. The transactions are measured on stocks, bonds, options contracts, futures contracts and commodities.
In financial technical analysis, the know sure thing (KST) oscillator is a complex, smoothed price velocity indicator developed by Martin J. Pring.

Chaikin Analytics is a platform for stock trading ideas. Chaikin Analytics was established in September 2009 by Marc Chaikin. The centerpiece of Chaikin Analytics is the Chaikin Power Gauge stock rating. In 2016, it was named one of "Two Top Websites for Quantitative Analysis" by Barron's.
The Buffett indicator is a valuation multiple used to assess how expensive or cheap the aggregate stock market is at a given point in time. It was proposed as a metric by investor Warren Buffett in 2001, who called it "probably the best single measure of where valuations stand at any given moment", and its modern form compares the capitalization of the US Wilshire 5000 index to US GDP. It is widely followed by the financial media as a valuation measure for the US market in both its absolute, and de-trended forms.

