A market trend is a perceived tendency of the financial markets to move in a particular direction over time. Analysts classify these trends as secular for long time-frames, primary for medium time-frames, and secondary for short time-frames. Traders attempt to identify market trends using technical analysis, a framework which characterizes market trends as predictable price tendencies within the market when price reaches support and resistance levels, varying over time.
A chartist is one who utilizes charts to assess patterns of activity that might be helpful in making predictions. Most commonly, chartists use technical analysis in the financial world to evaluate financial securities. For example, a chartist may plot past values of stock prices in an attempt to denote a trend from which he or she might infer future stock prices. The chartist's philosophy is that "history repeats itself". Technical analysis assumes that a stock's price reflects all that is known about a company at any given point in time.
In finance, technical analysis is an analysis methodology for analysing and forecasting the direction of prices through the study of past market data, primarily price and volume. As a type of active management, it stands in contradiction to much of modern portfolio theory. The efficacy of technical analysis is disputed by the efficient-market hypothesis, which states that stock market prices are essentially unpredictable, and research on whether technical analysis offers any benefit has produced mixed results. It is distinguished from fundamental analysis, which considers a company's financial statements, health, and the overall state of the market and economy.
The Elliott wave principle, or Elliott wave theory, is a form of technical analysis that helps financial traders analyze market cycles and forecast market trends by identifying extremes in investor psychology and price levels, such as highs and lows, by looking for patterns in prices. Ralph Nelson Elliott (1871–1948), an American accountant, developed a model for the underlying social principles of financial markets by studying their price movements, and developed a set of analytical tools in the 1930s. He proposed that market prices unfold in specific patterns, which practitioners today call Elliott waves, or simply waves. Elliott published his theory of market behavior in the book The Wave Principle in 1938, summarized it in a series of articles in Financial World magazine in 1939, and covered it most comprehensively in his final major work Nature's Laws: The Secret of the Universe in 1946. Elliott stated that "because man is subject to rhythmical procedure, calculations having to do with his activities can be projected far into the future with a justification and certainty heretofore unattainable".
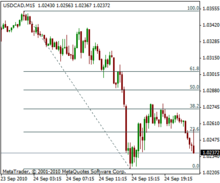
In stock market technical analysis, support and resistance are certain predetermined levels of the price of a security at which it is thought that the price will tend to stop and reverse. These levels are denoted by multiple touches of price without a breakthrough of the level.
Ralph Nelson Elliott was an American accountant and author whose study of stock market data led him to develop the Wave Principle, a description of the cyclical nature of trader psychology and a form of technical analysis. It identifies trends and reversals in financial markets. These cyclical patterns in price movements are known among practitioners of the method as Elliott waves.

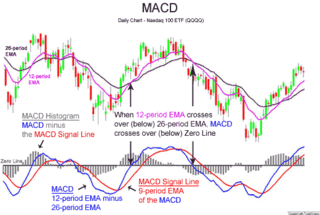
MACD, short for moving average convergence/divergence, is a trading indicator used in technical analysis of securities prices, created by Gerald Appel in the late 1970s. It is designed to reveal changes in the strength, direction, momentum, and duration of a trend in a stock's price.
Point and figure (P&F) is a charting technique used in technical analysis. Point and figure charting does not plot price against time as time-based charts do. Instead it plots price against changes in direction by plotting a column of Xs as the price rises and a column of Os as the price falls.
A chart pattern or price pattern is a pattern within a chart when prices are graphed. In stock and commodity markets trading, chart pattern studies play a large role during technical analysis. When data is plotted there is usually a pattern which naturally occurs and repeats over a period. Chart patterns are used as either reversal or continuation signals.
The commodity channel index (CCI) is an oscillator indicator that is used by traders and investors to help identify price reversals, price extremes and trend strength when using technical analysis to analyse financial markets.
In finance, a trend line is a bounding line for the price movement of a security. It is formed when a diagonal line can be drawn between a minimum of three or more price pivot points. A line can be drawn between any two points, but it does not qualify as a trend line until tested. Hence the need for the third point, the test. Trend lines are commonly used to decide entry and exit timing when trading securities. They can also be referred to as a Dutch line, as the concept was first used in Holland.

In financial markets, a pivot point is a price level that is used by traders as a possible indicator of market movement. A pivot point is calculated as an average of significant prices from the performance of a market in the prior trading period. If the market in the following period trades above the pivot point it is usually evaluated as a bullish sentiment, whereas trading below the pivot point is seen as bearish.
Robert R. Prechter Jr. is an American financial author, and stock market analyst, known for his financial forecasts using the Elliott Wave Principle. Prechter is an author and co-author of 14 books, and editor of 2 books, and his book Conquer the Crash was a New York Times bestseller in 2002. He also has published monthly financial commentary in the newsletter The Elliott Wave Theorist since 1979, and is the founder of Elliott Wave International and New Classics Library. Prechter served on the board of the CMT Association for nine years, and as its president in 1990–91. He has been a member of Mensa and Intertel. In recent years Prechter has supported the study of socionomics, a theory about human social behavior.
Stochastic oscillator is a momentum indicator within technical analysis that uses support and resistance levels as an oscillator. George Lane developed this indicator in the late 1950s. The term stochastic refers to the point of a current price in relation to its price range over a period of time. This method attempts to predict price turning points by comparing the closing price of a security to its price range.
The Vortex Indicator is a technical indicator invented by Etienne Botes and Douglas Siepman to identify the start of a new trend or the continuation of an existing trend within financial markets. It was published in the January 2010 edition of Technical Analysis of Stocks & Commodities.
Drummond Geometry is a trading method consisting of a series of technical analysis tools invented by the Canadian trader Charles Drummond starting in the 1970s and continuing to the present (2021). The method establishes support and resistance areas in multiple time periods and uses these to determine high probability trading areas.

Ichimoku Kinko Hyo (IKH) (Japanese: 一目均衡表, Hepburn: Ichimoku Kinkō Hyō), usually shortened to "Ichimoku", is a technical analysis method that builds on candlestick charting to improve the accuracy of forecast price moves.
Price action trading is about reading what the market is doing, so you can deploy the right trading strategy to reap the maximum benefits. In simple words, ‘Price Action Trading is a trading technique in which a trader reads the market and makes subjective trading decisions based on the price movements, rather than relying on technical indicators or other factors.

Anne-Marie Baiynd is an American author, financial analyst, technical analyst. Baiynd published her Market Positioning System (MPS) in 2011 to educate beginning day traders on the tools and techniques that have her listed in Traders at Work: World's Most Successful Traders Make Their Living in the Markets. Baiynd runs a day trading room where subscribers can follow her trades online and provides swing trading set-ups as well as trading education through her web site.

In finance, MIDAS is an approach to technical analysis initiated in 1995 by the physicist and technical analyst Paul Levine, PhD, and subsequently developed by Andrew Coles, PhD, and David Hawkins in a series of articles and the book MIDAS Technical Analysis: A VWAP Approach to Trading and Investing in Today's Markets. Latterly, several important contributions to the project, including new MIDAS curves and indicators, have been made by Bob English, many of them published in the book.


