Related Research Articles
A stock market bubble is a type of economic bubble taking place in stock markets when market participants drive stock prices above their value in relation to some system of stock valuation.
Financial economics is the branch of economics characterized by a "concentration on monetary activities", in which "money of one type or another is likely to appear on both sides of a trade". Its concern is thus the interrelation of financial variables, such as share prices, interest rates and exchange rates, as opposed to those concerning the real economy. It has two main areas of focus: asset pricing and corporate finance; the first being the perspective of providers of capital, i.e. investors, and the second of users of capital. It thus provides the theoretical underpinning for much of finance.
In finance, technical analysis is an analysis methodology for analysing and forecasting the direction of prices through the study of past market data, primarily price and volume. As a type of active management, it stands in contradiction to much of modern portfolio theory. The efficacy of technical analysis is disputed by the efficient-market hypothesis, which states that stock market prices are essentially unpredictable, and research on whether technical analysis offers any benefit has produced mixed results. It is distinguished from fundamental analysis, which considers a company's financial statements, health, and the overall state of the market and economy.
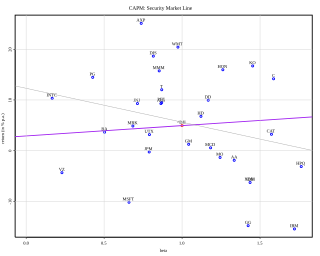
In finance, the capital asset pricing model (CAPM) is a model used to determine a theoretically appropriate required rate of return of an asset, to make decisions about adding assets to a well-diversified portfolio.

The efficient-market hypothesis (EMH) is a hypothesis in financial economics that states that asset prices reflect all available information. A direct implication is that it is impossible to "beat the market" consistently on a risk-adjusted basis since market prices should only react to new information.
The equity premium puzzle refers to the inability of an important class of economic models to explain the average equity risk premium (ERP) provided by a diversified portfolio of equities over that of government bonds, which has been observed for more than 100 years. There is a significant disparity between returns produced by stocks compared to returns produced by government treasury bills. The equity premium puzzle addresses the difficulty in understanding and explaining this disparity. This disparity is calculated using the equity risk premium:
Market portfolio is a portfolio consisting of a weighted sum of every asset in the market, with weights in the proportions that they exist in the market, with the necessary assumption that these assets are infinitely divisible.
Market timing is the strategy of making buying or selling decisions of financial assets by attempting to predict future market price movements. The prediction may be based on an outlook of market or economic conditions resulting from technical or fundamental analysis. This is an investment strategy based on the outlook for an aggregate market rather than for a particular financial asset.
In finance, a portfolio is a collection of investments.
A market anomaly in a financial market is predictability that seems to be inconsistent with theories of asset prices. Standard theories include the capital asset pricing model and the Fama-French Three Factor Model, but a lack of agreement among academics about the proper theory leads many to refer to anomalies without a reference to a benchmark theory. Indeed, many academics simply refer to anomalies as "return predictors", avoiding the problem of defining a benchmark theory.
The random walk hypothesis is a financial theory stating that stock market prices evolve according to a random walk and thus cannot be predicted.
Momentum investing is a system of buying stocks or other securities that have had high returns over the past three to twelve months, and selling those that have had poor returns over the same period.
The following outline is provided as an overview of and topical guide to finance:
Robert (Bob) Arthur Haugen was a financial economist and a pioneer in the field of quantitative investing and low-volatility investing. He was President of Haugen Custom Financial Systems and also consulted and spoke globally.
There are several concepts of efficiency for a financial market. The most widely discussed is informational or price efficiency, which is a measure of how quickly and completely the price of a single asset reflects available information about the asset's value. Other concepts include functional/operational efficiency, which is inversely related to the costs that investors bear for making transactions, and allocative efficiency, which is a measure of how far a market channels funds from ultimate lenders to ultimate borrowers in such a way that the funds are used in the most productive manner.
Sheridan Dean Titman is a professor of finance at the University of Texas at Austin, where he holds the McAllister Centennial Chair in Financial Services at the McCombs School of Business. He received a B.S. degree (1975) from the University of Colorado and an M.S. (1978) and Ph.D. (1981) from Carnegie Mellon University.
In asset pricing and portfolio management the Fama–French three-factor model is a statistical model designed in 1992 by Eugene Fama and Kenneth French to describe stock returns. Fama and French were colleagues at the University of Chicago Booth School of Business, where Fama still works. In 2013, Fama shared the Nobel Memorial Prize in Economic Sciences for his empirical analysis of asset prices. The three factors are (1) market excess return, (2) the outperformance of small versus big companies, and (3) the outperformance of high book/market versus low book/market companies. There is academic debate about the last two factors.
Quantitative analysis is the use of mathematical and statistical methods in finance and investment management. Those working in the field are quantitative analysts (quants). Quants tend to specialize in specific areas which may include derivative structuring or pricing, risk management, investment management and other related finance occupations. The occupation is similar to those in industrial mathematics in other industries. The process usually consists of searching vast databases for patterns, such as correlations among liquid assets or price-movement patterns.

In investing and finance, the low-volatility anomaly is the observation that low-volatility stocks have higher returns than high-volatility stocks in most markets studied. This is an example of a stock market anomaly since it contradicts the central prediction of many financial theories that taking higher risk must be compensated with higher returns.
Factor investing is an investment approach that involves targeting quantifiable firm characteristics or “factors” that can explain differences in stock returns. Security characteristics that may be included in a factor-based approach include size, low-volatility, value, momentum, asset growth, profitability, leverage, term and carry.
References
- ↑ Jegadeesh, N; Titman S (1999). "Profitability of Momentum Strategies: An Evaluation of Alternative Explanations". NBER Working Paper (7159).
- ↑ Jegadeesh, N; Titman S (1993). "Returns to Buying Winners and Selling Losers: Implications for Stock Market Efficiency". Journal of Finance. 48 (48): 65–91. doi:10.1111/j.1540-6261.1993.tb04702.x. S2CID 13713547.
- ↑ Low, R.K.Y.; Tan, E. (2016). "The Role of Analysts' Forecasts in the Momentum Effect" (PDF). International Review of Financial Analysis. 48: 67–84. doi:10.1016/j.irfa.2016.09.007.
- ↑ Daniel, K; Hirschleifer D; Subrahmanyam A (1998). "A Theory of Overconfidence, Self-Attribution, and Security Market Under and Over-reactions". Journal of Finance (53). doi:10.2139/ssrn.2017. hdl: 2027.42/35542 . S2CID 155014440.
- ↑ Barberis, N; Shleifer A; Vishny R (1998). "A Model of Investor Sentiment". Journal of Financial Economics. 49 (49): 307–343. doi:10.1016/S0304-405X(98)00027-0. S2CID 17623242.
- ↑ Crombez, J (2001). "Momentum, Rational Agents and Efficient Markets". The Journal of Psychology and Financial Markets. 2 (2): 190–200. doi:10.1207/S15327760JPFM0204_3. S2CID 155049349.