In finance, the capital asset pricing model (CAPM) is a model used to determine a theoretically appropriate required rate of return of an asset, to make decisions about adding assets to a well-diversified portfolio.
In mathematical finance, a risk-neutral measure is a probability measure such that each share price is exactly equal to the discounted expectation of the share price under this measure. This is heavily used in the pricing of financial derivatives due to the fundamental theorem of asset pricing, which implies that in a complete market a derivative's price is the discounted expected value of the future payoff under the unique risk-neutral measure. Such a measure exists if and only if the market is arbitrage-free.
Modern portfolio theory (MPT), or mean-variance analysis, is a mathematical framework for assembling a portfolio of assets such that the expected return is maximized for a given level of risk. It is a formalization and extension of diversification in investing, the idea that owning different kinds of financial assets is less risky than owning only one type. Its key insight is that an asset's risk and return should not be assessed by itself, but by how it contributes to a portfolio's overall risk and return. It uses the variance of asset prices as a proxy for risk.
In finance, the beta is a measure of how an individual asset moves when the overall stock market increases or decreases. Thus, beta is a useful measure of the contribution of an individual asset to the risk of the market portfolio when it is added in small quantity. Thus, beta is referred to as an asset's non-diversifiable risk, its systematic risk, market risk, or hedge ratio. Beta is not a measure of idiosyncratic risk.
In finance, the Sharpe ratio measures the performance of an investment compared to a risk-free asset, after adjusting for its risk. It is defined as the difference between the returns of the investment and the risk-free return, divided by the standard deviation of the investment. It represents the additional amount of return that an investor receives per unit of increase in risk.
In finance, Jensen's alpha is used to determine the abnormal return of a security or portfolio of securities over the theoretical expected return. It is a version of the standard alpha based on a theoretical performance index instead of a market index.
Alpha is a measure of the active return on an investment, the performance of that investment compared with a suitable market index. An alpha of 1% means the investment's return on investment over a selected period of time was 1% better than the market during that same period; a negative alpha means the investment underperformed the market. Alpha, along with beta, is one of two key coefficients in the capital asset pricing model used in modern portfolio theory and is closely related to other important quantities such as standard deviation, R-squared and the Sharpe ratio.
The information ratio, also known as appraisal ratio, measures and compares the active return of an investment compared to a benchmark index relative to the volatility of the active return. It is defined as the active return divided by the tracking error. It represents the additional amount of return that an investor receives per unit of increase in risk.

In finance, diversification is the process of allocating capital in a way that reduces the exposure to any one particular asset or risk. A common path towards diversification is to reduce risk or volatility by investing in a variety of assets. If asset prices do not change in perfect synchrony, a diversified portfolio will have less variance than the weighted average variance of its constituent assets, and often less volatility than the least volatile of its constituents.

Constant proportion portfolio investment (CPPI) is a trading strategy that allows an investor to maintain an exposure to the upside potential of a risky asset while providing a capital guarantee against downside risk. The outcome of the CPPI strategy is somewhat similar to that of buying a call option, but does not use option contracts. Thus CPPI is sometimes referred to as a convex strategy, as opposed to a "concave strategy" like constant mix.
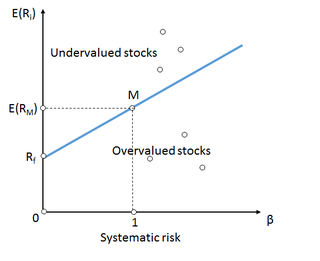
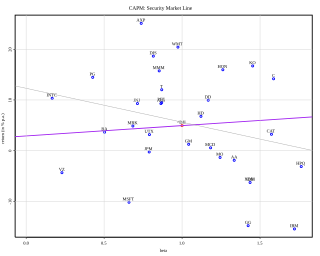
Security market line (SML) is the representation of the capital asset pricing model. It displays the expected rate of return of an individual security as a function of systematic, non-diversifiable risk. The risk of an individual risky security reflects the volatility of the return from security rather than the return of the market portfolio. The risk in these individual risky securities reflects the systematic risk.

In economics and finance, exponential utility is a specific form of the utility function, used in some contexts because of its convenience when risk is present, in which case expected utility is maximized. Formally, exponential utility is given by:
In Finance the Treynor–Black model is a mathematical model for security selection published by Fischer Black and Jack Treynor in 1973. The model assumes an investor who considers that most securities are priced efficiently, but who believes they have information that can be used to predict the abnormal performance (Alpha) of a few of them; the model finds the optimum portfolio to hold under such conditions.

Capital allocation line (CAL) is a graph created by investors to measure the risk of risky and risk-free assets. The graph displays the return to be made by taking on a certain level of risk. Its slope is known as the "reward-to-variability ratio".
Risk parity is an approach to investment management which focuses on allocation of risk, usually defined as volatility, rather than allocation of capital. The risk parity approach asserts that when asset allocations are adjusted to the same risk level, the risk parity portfolio can achieve a higher Sharpe ratio and can be more resistant to market downturns than the traditional portfolio. Risk parity is vulnerable to significant shifts in correlation regimes, such as observed in Q1 2020, which led to the significant underperformance of risk-parity funds in the Covid19 sell-off.
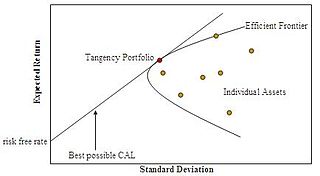
In modern portfolio theory, the efficient frontier is an investment portfolio which occupies the "efficient" parts of the risk–return spectrum. Formally, it is the set of portfolios which satisfy the condition that no other portfolio exists with a higher expected return but with the same standard deviation of return. The efficient frontier was first formulated by Harry Markowitz in 1952; see Markowitz model.
The Penalized Present Value (PPV) is a method of capital budgeting under risk developed by Fernando Gómez-Bezares in the 1980s.
Modigliani risk-adjusted performance (also known as M2, M2, Modigliani–Modigliani measure or RAP) is a measure of the risk-adjusted returns of some investment portfolio. It measures the returns of the portfolio, adjusted for the risk of the portfolio relative to that of some benchmark (e.g., the market). We can interpret the measure as the difference between the scaled excess return of our portfolio P and that of the market, where the scaled portfolio has the same volatility as the market. It is derived from the widely used Sharpe ratio, but it has the significant advantage of being in units of percent return (as opposed to the Sharpe ratio – an abstract, dimensionless ratio of limited utility to most investors), which makes it dramatically more intuitive to interpret.
In portfolio theory, a mutual fund separation theorem, mutual fund theorem, or separation theorem is a theorem stating that, under certain conditions, any investor's optimal portfolio can be constructed by holding each of certain mutual funds in appropriate ratios, where the number of mutual funds is smaller than the number of individual assets in the portfolio. Here a mutual fund refers to any specified benchmark portfolio of the available assets. There are two advantages of having a mutual fund theorem. First, if the relevant conditions are met, it may be easier for an investor to purchase a smaller number of mutual funds than to purchase a larger number of assets individually. Second, from a theoretical and empirical standpoint, if it can be assumed that the relevant conditions are indeed satisfied, then implications for the functioning of asset markets can be derived and tested.
In finance, the Markowitz model - put forward by Harry Markowitz in 1952 - is a portfolio optimization model; it assists in the selection of the most efficient portfolio by analyzing various possible portfolios of the given securities. Here, by choosing securities that do not 'move' exactly together, the HM model shows investors how to reduce their risk. The HM model is also called mean-variance model due to the fact that it is based on expected returns (mean) and the standard deviation (variance) of the various portfolios. It is foundational to Modern portfolio theory.


