Related Research Articles
Fundamental analysis, in accounting and finance, is the analysis of a business's financial statements ; health; competitors and markets. It also considers the overall state of the economy and factors including interest rates, production, earnings, employment, GDP, housing, manufacturing and management. There are two basic approaches that can be used: bottom up analysis and top down analysis. These terms are used to distinguish such analysis from other types of investment analysis, such as quantitative and technical.
Investment is traditionally defined as the "commitment of resources to achieve later benefits". If an investment involves money, then it can be defined as a "commitment of money to receive more money later". From a broader viewpoint, an investment can be defined as "to tailor the pattern of expenditure and receipt of resources to optimise the desirable patterns of these flows". When expenditures and receipts are defined in terms of money, then the net monetary receipt in a time period is termed cash flow, while money received in a series of several time periods is termed cash flow stream.
In finance, technical analysis is an analysis methodology for analysing and forecasting the direction of prices through the study of past market data, primarily price and volume. As a type of active management, it stands in contradiction to much of modern portfolio theory. The efficacy of technical analysis is disputed by the efficient-market hypothesis, which states that stock market prices are essentially unpredictable, and research on whether technical analysis offers any benefit has produced mixed results. It is distinguished from fundamental analysis, which considers a company's financial statements, health, and the overall state of the market and economy.

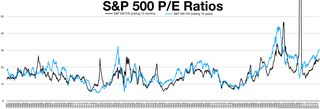
The price–earnings ratio, also known as P/E ratio, P/E, or PER, is the ratio of a company's share (stock) price to the company's earnings per share. The ratio is used for valuing companies and to find out whether they are overvalued or undervalued.
Enterprise value (EV), total enterprise value (TEV), or firm value (FV) is an economic measure reflecting the market value of a business. It is a sum of claims by all claimants: creditors and shareholders. Enterprise value is one of the fundamental metrics used in business valuation, financial analysis, accounting, portfolio analysis, and risk analysis.
In finance, statistical arbitrage is a class of short-term financial trading strategies that employ mean reversion models involving broadly diversified portfolios of securities held for short periods of time. These strategies are supported by substantial mathematical, computational, and trading platforms.

Bollinger Bands are a type of statistical chart characterizing the prices and volatility over time of a financial instrument or commodity, using a formulaic method propounded by John Bollinger in the 1980s. Financial traders employ these charts as a methodical tool to inform trading decisions, control automated trading systems, or as a component of technical analysis. Bollinger Bands display a graphical band and volatility in one two-dimensional chart.

A pairs trade or pair trading is a market neutral trading strategy enabling traders to profit from virtually any market conditions: uptrend, downtrend, or sideways movement. This strategy is categorized as a statistical arbitrage and convergence trading strategy. Pair trading was pioneered by Gerry Bamberger and later led by Nunzio Tartaglia's quantitative group at Morgan Stanley in the 1980s.
The "Fed model", or "Fed Stock Valuation Model" (FSVM), is a disputed theory of equity valuation that compares the stock market's forward earnings yield to the nominal yield on long-term government bonds, and that the stock market – as a whole – is fairly valued, when the one-year forward-looking I/B/E/S earnings yield equals the 10-year nominal Treasury yield; deviations suggest over-or-under valuation.
An event study is a statistical method to assess the impact of an event.
The following outline is provided as an overview of and topical guide to finance:
The Rendleman–Bartter model in finance is a short-rate model describing the evolution of interest rates. It is a "one factor model" as it describes interest rate movements as driven by only one source of market risk. It can be used in the valuation of interest rate derivatives. It is a stochastic asset model.

In finance, volatility is the degree of variation of a trading price series over time, usually measured by the standard deviation of logarithmic returns.
Quantitative behavioral finance is a new discipline that uses mathematical and statistical methodology to understand behavioral biases in conjunction with valuation.

Stocks for the Long Run is a book on investing by Jeremy Siegel. Its first edition was released in 1994. Its fifth edition was released on January 7, 2014. According to Pablo Galarza of Money, "His 1994 book Stocks for the Long Run sealed the conventional wisdom that most of us should be in the stock market." James K. Glassman, a financial columnist for The Washington Post, called it one of the 10 best investment books of all time.
The S&P/ASX 300, or simply, ASX 300, is a stock market index of Australian stocks listed on the Australian Securities Exchange (ASX). The index is market-capitalisation weighted, meaning each company included is in proportion to the indexes total market value, and float-adjusted, meaning the index only considers shares available to public investors.
Quantitative analysis is the use of mathematical and statistical methods in finance and investment management. Those working in the field are quantitative analysts (quants). Quants tend to specialize in specific areas which may include derivative structuring or pricing, risk management, investment management and other related finance occupations. The occupation is similar to those in industrial mathematics in other industries. The process usually consists of searching vast databases for patterns, such as correlations among liquid assets or price-movement patterns.

A share price is the price of a single share of a number of saleable equity shares of a company. In layman's terms, the stock price is the highest amount someone is willing to pay for the stock, or the lowest amount that it can be bought for.
The cyclically adjusted price-to-earnings ratio, commonly known as CAPE, Shiller P/E, or P/E 10 ratio, is a stock valuation measure usually applied to the US S&P 500 equity market. It is defined as price divided by the average of ten years of earnings, adjusted for inflation. As such, it is principally used to assess likely future returns from equities over timescales of 10 to 20 years, with higher than average CAPE values implying lower than average long-term annual average returns.
The Buffett indicator is a valuation multiple used to assess how expensive or cheap the aggregate stock market is at a given point in time. It was proposed as a metric by investor Warren Buffett in 2001, who called it "probably the best single measure of where valuations stand at any given moment", and its modern form compares the capitalization of the US Wilshire 5000 index to US GDP. It is widely followed by the financial media as a valuation measure for the US market in both its absolute, and de-trended forms.
References
- ↑ Mean reversion
- ↑ Mahdavi Damghani, Babak (2013). "The Non-Misleading Value of Inferred Correlation: An Introduction to the Cointelation Model". Wilmott . 2013 (1): 50–61. doi:10.1002/wilm.10252.
- ↑ Lipe, Robert (1994). "Mean reversion in annual earnings and its implications for security valuation". Review of Quantitative Finance and Accounting . 1994 (4): 27–46. doi:10.1007/BF01082663. hdl: 2027.42/47883 . S2CID 54829558.
- ↑ Siu-tang, Leung Tim; Xin, Li (2015-11-26). Optimal Mean Reversion Trading: Mathematical Analysis And Practical Applications. World Scientific. ISBN 978-981-4725-93-4.
- ↑ Siegel, Jeremy (November 27, 2007). Stocks for the Long Run (4th ed.). McGraw–Hill. pp. 13, 28–29. ISBN 978-0071494700.