Security characteristic line

Last updated
Security characteristic line

Positive abnormal return (a): Above-average returns that cannot be explained as compensation for added risk

Negative abnormal returns (a): Below-average returns that cannot be explained by below-market risk SCL-plot.PNG
Security characteristic line

Positive abnormal return (α): Above-average returns that cannot be explained as compensation for added risk

Negative abnormal returns (α): Below-average returns that cannot be explained by below-market risk

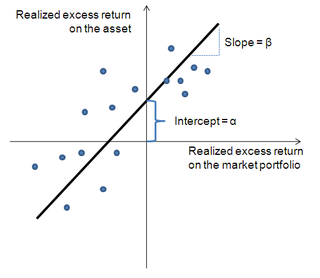
Security characteristic line (SCL) is a regression line, [1] plotting performance of a particular security or portfolio against that of the market portfolio at every point in time. The SCL is plotted on a graph where the Y-axis is the excess return on a security over the risk-free return and the X-axis is the excess return of the market in general. The slope of the SCL is the security's beta, and the intercept is its alpha. [2]

Regression analysis set of statistical processes for estimating the relationships among variables

In statistical modeling, regression analysis is a set of statistical processes for estimating the relationships among variables. It includes many techniques for modeling and analyzing several variables, when the focus is on the relationship between a dependent variable and one or more independent variables. More specifically, regression analysis helps one understand how the typical value of the dependent variable changes when any one of the independent variables is varied, while the other independent variables are held fixed.

Market portfolio is a portfolio consisting of a weighted sum of every asset in the market, with weights in the proportions that they exist in the market, with the necessary assumption that these assets are infinitely divisible.

The risk-free interest rate is the rate of return of a hypothetical investment with no risk of financial loss, over a given period of time.

Contents

Formula

where:

αi is called the asset's alpha (abnormal return)
βi(RM,tRf) is a nondiversifiable or systematic risk
εi,t is the non-systematic or diversifiable, non-market or idiosyncratic risk
RM,t is a market risk
Rf is a risk-free rate

See also

Security market line

Security market line (SML) is the representation of the capital asset pricing model. It displays the expected rate of return of an individual security as a function of systematic, non-diversifiable risk. The risk of an individual risky security reflects the volatility of the return from security rather than the return of the market portfolio. The risk in these individual risky securities reflects the systematic risk.

Capital allocation line

Capital allocation line (CAL) is a graph created by investors to measure the risk of risky and risk-free assets. The graph displays the return to be made by taking on a certain level of risk. Its slope is known as the "reward-to-variability ratio".

Capital market line

Capital market line (CML) is the tangent line drawn from the point of the risk-free asset to the feasible region for risky assets. The tangency point M represents the market portfolio, so named since all rational investors should hold their risky assets in the same proportions as their weights in the market portfolio.

Related Research Articles

Capital asset pricing model

In finance, the capital asset pricing model (CAPM) is a model used to determine a theoretically appropriate required rate of return of an asset, to make decisions about adding assets to a well-diversified portfolio.

Modern portfolio theory (MPT), or mean-variance analysis, is a mathematical framework for assembling a portfolio of assets such that the expected return is maximized for a given level of risk. It is a formalization and extension of diversification in investing, the idea that owning different kinds of financial assets is less risky than owning only one type. Its key insight is that an asset's risk and return should not be assessed by itself, but by how it contributes to a portfolio's overall risk and return. It uses the variance of asset prices as a proxy for risk.

In finance, arbitrage pricing theory (APT) is a general theory of asset pricing that holds that the expected return of a financial asset can be modeled as a linear function of various factors or theoretical market indices, where sensitivity to changes in each factor is represented by a factor-specific beta coefficient. The model-derived rate of return will then be used to price the asset correctly—the asset price should equal the expected end of period price discounted at the rate implied by the model. If the price diverges, arbitrage should bring it back into line.

In finance, the beta of an investment indicates whether the investment is more or less volatile than the market as a whole.

In finance, Jensen's alpha is used to determine the abnormal return of a security or portfolio of securities over the theoretical expected return. It is a version of the standard alpha based on a theoretical performance index instead of a market index.

The Treynor reward to volatility model, named after Jack L. Treynor, is a measurement of the returns earned in excess of that which could have been earned on an investment that has no diversifiable risk, per each unit of market risk assumed.

Alpha is a measure of the active return on an investment, the performance of that investment compared with a suitable market index. An alpha of 1% means the investment's return on investment over a selected period of time was 1% better than the market during that same period; a negative alpha means the investment underperformed the market. Alpha, along with beta, is one of two key coefficients in the capital asset pricing model used in modern portfolio theory and is closely related to other important quantities such as standard deviation, R-squared and the Sharpe ratio.

The single-index model (SIM) is a simple asset pricing model to measure both the risk and the return of a stock. The model has been developed by William Sharpe in 1963 and is commonly used in the finance industry. Mathematically the SIM is expressed as:

The consumption-based capital asset pricing model (CCAPM) is used in finance and economics as an expansion of the capital asset pricing model (CAPM). The CCAPM factors in consumption as a means of understanding and calculating an expected return on investment.

Roll's critique is a famous analysis of the validity of empirical tests of the capital asset pricing model (CAPM) by Richard Roll. It concerns methods to formally test the statement of the CAPM, the equation

In asset pricing and portfolio management the Fama–French three-factor model is a model designed by Eugene Fama and Kenneth French to describe stock returns. Fama and French were professors at the University of Chicago Booth School of Business, where Fama still resides. The three factors are (1) market risk, (2) the outperformance of small versus big companies, and (3) the outperformance of high book/market versus small book/market companies. However, the size and book/market ratio themselves are not in the model. For this reason, there is academic debate about the meaning of the last two factors.

A Portfolio Manager is a professional responsible for making investment decisions and carrying out investment activities on behalf of vested individuals or institutions. The investors invest their money into the portfolio manager's investment policy for future fund growth such as a retirement fund, endowment fund, education fund and other purposes. Portfolio managers work with a team of analysts and researchers, and are responsible for establishing an investment strategy, selecting appropriate investments and allocating each investment properly towards an investment fund or asset management vehicle.

In Finance the Treynor–Black model is a mathematical model for security selection published by Fischer Black and Jack Treynor in 1973. The model assumes an investor who considers that most securities are priced efficiently, but who believes they have information that can be used to predict the abnormal performance (Alpha) of a few of them; the model finds the optimum portfolio to hold under such conditions.

Modigliani risk-adjusted performance (also known as M2, M2, Modigliani–Modigliani measure or RAP) is a measure of the risk-adjusted returns of some investment portfolio. It measures the returns of the portfolio, adjusted for the risk of the portfolio relative to that of some benchmark (e.g., the market). We can interpret the measure as the difference between the scaled excess return of our portfolio P and that of the market, where the scaled portfolio has the same volatility as the market. It is derived from the widely used Sharpe ratio, but it has the significant advantage of being in units of percent return (as opposed to the Sharpe ratio – an abstract, dimensionless ratio of limited utility to most investors), which makes it dramatically more intuitive to interpret.

Returns-based style analysis is a statistical technique used in finance to deconstruct the returns of investment strategies using a variety of explanatory variables. The model results in a strategy’s exposures to asset classes or other factors, interpreted as a measure of a fund or portfolio manager’s style. While the model is most frequently used to show an equity mutual fund’s style with reference to common style axes, recent applications have extended the model’s utility to model more complex strategies, such as those employed by hedge funds. Returns based strategies that use factors such as momentum signals have been popular to the extent that industry analysts incorporate their use in their Buy/Sell recommendations.

In portfolio management the Carhart four-factor model is an extension of the Fama–French three-factor model including a momentum factor for asset pricing of stocks. It is also known in the industry as the MOM factor. Momentum in a stock is described as the tendency for the stock price to continue rising if it is going up and to continue declining if it is going down.

In investing, downside beta is the element of beta that investors associate with risk in the sense of the uncertain potential for loss. It is defined to be the scaled amount by which an asset tends to move compared to a benchmark, calculated only on days when the benchmark’s return is negative.

Nontraded assets are assets that are not traded on the market. Human capital is the most important nontraded assets. Other important nontraded asset classes are private businesses, claims to government transfer payments and claims on trust income.

References