A market trend is a perceived tendency of the financial markets to move in a particular direction over time. Analysts classify these trends as secular for long time-frames, primary for medium time-frames, and secondary for short time-frames. Traders attempt to identify market trends using technical analysis, a framework which characterizes market trends as predictable price tendencies within the market when price reaches support and resistance levels, varying over time.
In finance, technical analysis is an analysis methodology for analysing and forecasting the direction of prices through the study of past market data, primarily price and volume. As a type of active management, it stands in contradiction to much of modern portfolio theory. The efficacy of technical analysis is disputed by the efficient-market hypothesis, which states that stock market prices are essentially unpredictable, and research on whether technical analysis offers any benefit has produced mixed results. It is distinguished from fundamental analysis, which considers a company's financial statements, health, and the overall state of the market and economy.

Day trading is a form of speculation in securities in which a trader buys and sells a financial instrument within the same trading day, so that all positions are closed before the market closes for the trading day to avoid unmanageable risks and negative price gaps between one day's close and the next day's price at the open. Traders who trade in this capacity are generally classified as speculators. Day trading contrasts with the long-term trades underlying buy-and-hold and value investing strategies. Day trading may require fast trade execution, sometimes as fast as milli-seconds in scalping, therefore direct-access day trading software is often needed.

MACD, short for moving average convergence/divergence, is a trading indicator used in technical analysis of securities prices, created by Gerald Appel in the late 1970s. It is designed to reveal changes in the strength, direction, momentum, and duration of a trend in a stock's price.
A breakout is when prices pass through and stay through an area of support or resistance. On the technical analysis chart a break out occurs when price of a stock or commodity exits an area pattern. Oftentimes, a stock or commodity will bounce between the areas of support and resistance and when it breaks through either one of these barriers you can consider the direction that it's heading in a trend. Often the resistance level the price breaks through becomes a new support level, and vice versa. This can be a "Buy" or "Sell" signal depending on which barrier it broke through.
Swing trading is a speculative trading strategy in financial markets where a tradable asset is held for one or more days in an effort to profit from price changes or 'swings'. A swing trading position is typically held longer than a day trading position, but shorter than buy and hold investment strategies that can be held for months or years. Profits can be sought by either buying an asset or short selling. Momentum signals have been shown to be used by financial analysts in their buy and sell recommendations that can be applied in swing trading.
Sector rotation is a theory of stock market trading patterns.
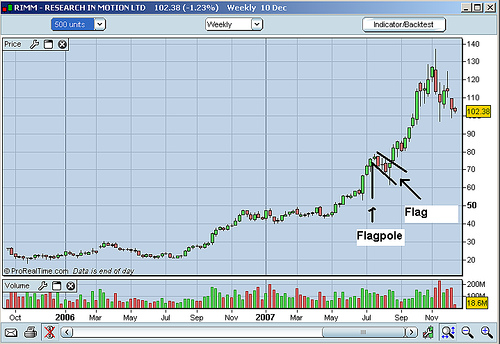
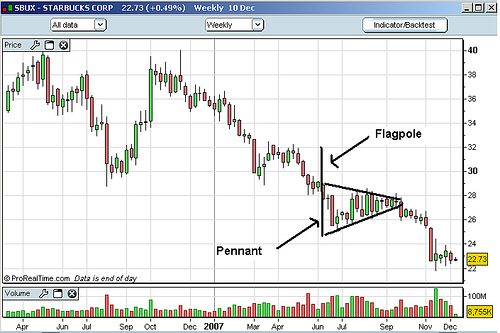
A chart pattern or price pattern is a pattern within a chart when prices are graphed. In stock and commodity markets trading, chart pattern studies play a large role during technical analysis. When data is plotted there is usually a pattern which naturally occurs and repeats over a period. Chart patterns are used as either reversal or continuation signals.

A stock trader or equity trader or share trader, also called a stock investor, is a person or company involved in trading equity securities and attempting to profit from the purchase and sale of those securities. Stock traders may be an investor, agent, hedger, arbitrageur, speculator, or stockbroker. Such equity trading in large publicly traded companies may be through a stock exchange. Stock shares in smaller public companies may be bought and sold in over-the-counter (OTC) markets or in some instances in equity crowdfunding platforms.
The commodity channel index (CCI) is an oscillator indicator that is used by traders and investors to help identify price reversals, price extremes and trend strength when using technical analysis to analyse financial markets.

The Kagi chart is a chart used for tracking price movements and to make decisions on purchasing stock. It differs from traditional stock charts such as the Candlestick chart by being mostly independent of time. This feature aids in producing a chart that reduces random noise.
Trend following or trend trading is a trading strategy according to which one should buy an asset when its price trend goes up, and sell when its trend goes down, expecting price movements to continue.
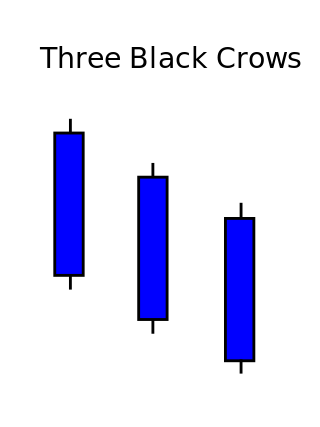
Three crows is a term used by stock market analysts to describe a market downturn. It appears on a candlestick chart in the financial markets. It unfolds across three trading sessions, and consists of three long candlesticks that trend downward like a staircase. Each candle should open below the previous day's open, ideally in the middle price range of that previous day. Each candlestick should also close progressively downward to establish a new near-term low. The pattern indicates a strong price reversal from a bull market to a bear market.
CAN SLIM is an acronym developed by the American investor William O'Neil, intended to represent the seven characteristics that top-performing stocks often share before making their biggest price gains.
On the technical analysis chart, a wedge pattern is a market trend commonly found in traded assets. The pattern is characterized by a contracting range in prices coupled with an upward trend in prices or a downward trend in prices.
Broadening top is technical analysis chart pattern describing trends of stocks, commodities, currencies, and other assets. Broadening Top formation appears much more frequently at tops than at bottoms. Its formation usually has bearish implications.
Double top and double bottom are reversal chart patterns observed in the technical analysis of financial trading markets of stocks, commodities, currencies, and other assets.

In finance, Fibonacci retracement is a method of technical analysis for determining support and resistance levels. It is named after the Fibonacci sequence of numbers, whose ratios provide price levels to which markets tend to retrace a portion of a move, before a trend continues in the original direction.
Price action is a method of analysis of the basic price movements to generate trade entry and exit signals that is considered reliable while not requiring the use of indicators. It is a form of technical analysis, as it ignores the fundamental factors of a security and looks primarily at the security's price history. However, this method is different from other forms of technical analysis, as it focuses on the relation of the security's current price to its price history, which consists of all price movements, as opposed to values derived from the price history.

Volume Analysis is an example of a type of technical analysis that examines the volume of traded securities to confirm and predict price trends. Volume is a measure of the number of shares of an asset that are traded in a given period of time. As one of the oldest market indicators used for analysis, sudden changes in volume are often the result of news-related events. Commonly used by chartists and technical analysts, volume analysis is centered on the following ideas: