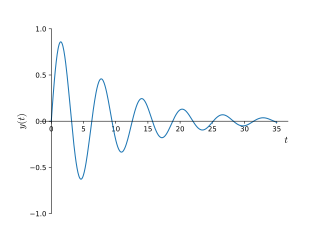
In physics and engineering, the quality factor or Q factor is a dimensionless parameter that describes how underdamped an oscillator or resonator is. It is defined as the ratio of the initial energy stored in the resonator to the energy lost in one radian of the cycle of oscillation. Q factor is alternatively defined as the ratio of a resonator's centre frequency to its bandwidth when subject to an oscillating driving force. These two definitions give numerically similar, but not identical, results. Higher Q indicates a lower rate of energy loss and the oscillations die out more slowly. A pendulum suspended from a high-quality bearing, oscillating in air, has a high Q, while a pendulum immersed in oil has a low one. Resonators with high quality factors have low damping, so that they ring or vibrate longer.
The relative strength index (RSI) is a technical indicator used in the analysis of financial markets. It is intended to chart the current and historical strength or weakness of a stock or market based on the closing prices of a recent trading period. The indicator should not be confused with relative strength.
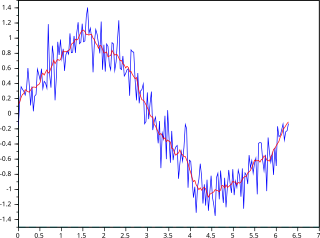
In statistics, a moving average is a calculation to analyze data points by creating a series of averages of different selections of the full data set. Variations include: simple, cumulative, or weighted forms.

MACD, short for moving average convergence/divergence, is a trading indicator used in technical analysis of securities prices, created by Gerald Appel in the late 1970s. It is designed to reveal changes in the strength, direction, momentum, and duration of a trend in a stock's price.
Point and figure (P&F) is a charting technique used in technical analysis. Point and figure charting does not plot price against time as time-based charts do. Instead it plots price against changes in direction by plotting a column of Xs as the price rises and a column of Os as the price falls.
The money flow index (MFI) is an oscillator that ranges from 0 to 100. It is used to show the money flow over several days.
In financial technical analysis, momentum (MTM) and rate of change (ROC) are simple indicators showing the difference between today's closing price and the close N days ago. Momentum is the absolute difference in stock, commodity:
Exponential smoothing or exponential moving average (EMA) is a rule of thumb technique for smoothing time series data using the exponential window function. Whereas in the simple moving average the past observations are weighted equally, exponential functions are used to assign exponentially decreasing weights over time. It is an easily learned and easily applied procedure for making some determination based on prior assumptions by the user, such as seasonality. Exponential smoothing is often used for analysis of time-series data.

Trix is a technical analysis oscillator developed in the 1980s by Jack Hutson, editor of Technical Analysis of Stocks and Commodities magazine. It shows the slope of a triple-smoothed exponential moving average. The name Trix is from "triple exponential."
The commodity channel index (CCI) is an oscillator indicator that is used by traders and investors to help identify price reversals, price extremes and trend strength when using technical analysis to analyse financial markets.
The accumulation/distribution line or accumulation/distribution index in the stock market, is a technical analysis indicator intended to relate price and volume, which supposedly acts as a leading indicator of price movements. It provides a measure of the commitment of bulls and bears to the market and is used to detect divergences between volume and price action - signs that a trend is weakening.

Keltner channel is a technical analysis indicator showing a central moving average line plus channel lines at a distance above and below. The indicator is named after Chester W. Keltner (1909–1998) who described it in his 1960 book How To Make Money in Commodities. This name was applied by those who heard about it from him, but Keltner called it the ten-day moving average trading rule and indeed made no claim to any originality for the idea.
The Coppock curve or Coppock indicator is a technical analysis indicator for long-term stock market investors created by E.S.C. Coppock, first published in Barron's Magazine on October 15, 1962.
Stochastic oscillator is a momentum indicator within technical analysis that uses support and resistance levels as an oscillator. George Lane developed this indicator in the late 1950s. The term stochastic refers to the point of a current price in relation to its price range over a period of time. This method attempts to predict price turning points by comparing the closing price of a security to its price range.
The average directional movement index (ADX) was developed in 1978 by J. Welles Wilder as an indicator of trend strength in a series of prices of a financial instrument. ADX has become a widely used indicator for technical analysts, and is provided as a standard in collections of indicators offered by various trading platforms.
In financial technical analysis, the know sure thing (KST) oscillator is a complex, smoothed price velocity indicator developed by Martin J. Pring.
The true strength index (TSI) is a technical indicator used in the analysis of financial markets that attempts to show both trend direction and overbought/oversold conditions. It was first published William Blau in 1991. The indicator uses moving averages of the underlying momentum of a financial instrument. Momentum is considered a leading indicator of price movements, and a moving average characteristically lags behind price. The TSI combines these characteristics to create an indication of price and direction more in sync with market turns than either momentum or moving average. The TSI is provided as part of the standard collection of indicators offered by various trading platforms.
Price action is a method of analysis of the basic price movements to generate trade entry and exit signals that is considered reliable while not requiring the use of indicators. It is a form of technical analysis, as it ignores the fundamental factors of a security and looks primarily at the security's price history. However, this method is different from other forms of technical analysis, as it focuses on the relation of the security's current price to its price history, which consists of all price movements, as opposed to values derived from the price history.

Chaikin Analytics is a platform for stock trading ideas. Chaikin Analytics was established in September 2009 by Marc Chaikin. The centerpiece of Chaikin Analytics is the Chaikin Power Gauge stock rating. In 2016, it was named one of "Two Top Websites for Quantitative Analysis" by Barron's.

Volume Analysis is an example of a type of technical analysis that examines the volume of traded securities to confirm and predict price trends. Volume is a measure of the number of shares of an asset that are traded in a given period of time. As one of the oldest market indicators used for analysis, sudden changes in volume are often the result of news-related events. Commonly used by chartists and technical analysts, volume analysis is centered on the following ideas:
