The relative strength index (RSI) is a technical indicator used in the analysis of financial markets. It is intended to chart the current and historical strength or weakness of a stock or market based on the closing prices of a recent trading period. The indicator should not be confused with relative strength.
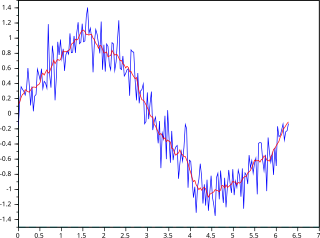
In statistics, a moving average is a calculation to analyze data points by creating a series of averages of different selections of the full data set. Variations include: simple, cumulative, or weighted forms.

A candlestick chart is a style of financial chart used to describe price movements of a security, derivative, or currency.
In stock and securities market technical analysis, parabolic SAR is a method devised by J. Welles Wilder Jr., to find potential reversals in the market price direction of traded goods such as securities or currency exchanges such as forex. It is a trend-following (lagging) indicator and may be used to set a trailing stop loss or determine entry or exit points based on prices tending to stay within a parabolic curve during a strong trend.

MACD, short for moving average convergence/divergence, is a trading indicator used in technical analysis of securities prices, created by Gerald Appel in the late 1970s. It is designed to reveal changes in the strength, direction, momentum, and duration of a trend in a stock's price.

Bollinger Bands are a type of statistical chart characterizing the prices and volatility over time of a financial instrument or commodity, using a formulaic method propounded by John Bollinger in the 1980s. Financial traders employ these charts as a methodical tool to inform trading decisions, control automated trading systems, or as a component of technical analysis. Bollinger Bands display a graphical band and volatility in one two-dimensional chart.
In finance, a day count convention determines how interest accrues over time for a variety of investments, including bonds, notes, loans, mortgages, medium-term notes, swaps, and forward rate agreements (FRAs). This determines the number of days between two coupon payments, thus calculating the amount transferred on payment dates and also the accrued interest for dates between payments. The day count is also used to quantify periods of time when discounting a cash-flow to its present value. When a security such as a bond is sold between interest payment dates, the seller is eligible to some fraction of the coupon amount.
Williams %R, or just %R, is a technical analysis oscillator showing the current closing price in relation to the high and low of the past N days. It was developed by a publisher and promoter of trading materials, Larry Williams. Its purpose is to tell whether a stock or commodity market is trading near the high or the low, or somewhere in between, of its recent trading range.
The commodity channel index (CCI) is an oscillator indicator that is used by traders and investors to help identify price reversals, price extremes and trend strength when using technical analysis to analyse financial markets.
Average true range (ATR) is a technical analysis volatility indicator originally developed by J. Welles Wilder, Jr. for commodities. The indicator does not provide an indication of price trend, simply the degree of price volatility. The average true range is an N-period smoothed moving average (SMMA) of the true range values. Wilder recommended a 14-period smoothing.

The detrended price oscillator (DPO) is an indicator in technical analysis that attempts to eliminate the long-term trends in prices by using a displaced moving average so it does not react to the most current price action. This allows the indicator to show intermediate overbought and oversold levels effectively.

In financial markets, a pivot point is a price level that is used by traders as a possible indicator of market movement. A pivot point is calculated as an average of significant prices from the performance of a market in the prior trading period. If the market in the following period trades above the pivot point it is usually evaluated as a bullish sentiment, whereas trading below the pivot point is seen as bearish.
Stochastic oscillator is a momentum indicator within technical analysis that uses support and resistance levels as an oscillator. George Lane developed this indicator in the late 1950s. The term stochastic refers to the point of a current price in relation to its price range over a period of time. This method attempts to predict price turning points by comparing the closing price of a security to its price range.
An automated trading system (ATS), a subset of algorithmic trading, uses a computer program to create buy and sell orders and automatically submits the orders to a market center or exchange. The computer program will automatically generate orders based on predefined set of rules using a trading strategy which is based on technical analysis, advanced statistical and mathematical computations or input from other electronic sources.
The doji is a commonly found pattern in a candlestick chart of financially traded assets in technical analysis. It is characterized by being small in length—meaning a small trading range—with an opening and closing price that are virtually equal. The efficacy of technical analysis is disputed by the efficient-market hypothesis, which states that stock market prices are essentially unpredictable.
The Vortex Indicator is a technical indicator invented by Etienne Botes and Douglas Siepman to identify the start of a new trend or the continuation of an existing trend within financial markets. It was published in the January 2010 edition of Technical Analysis of Stocks & Commodities.
The true strength index (TSI) is a technical indicator used in the analysis of financial markets that attempts to show both trend direction and overbought/oversold conditions. It was first published William Blau in 1991. The indicator uses moving averages of the underlying momentum of a financial instrument. Momentum is considered a leading indicator of price movements, and a moving average characteristically lags behind price. The TSI combines these characteristics to create an indication of price and direction more in sync with market turns than either momentum or moving average. The TSI is provided as part of the standard collection of indicators offered by various trading platforms.

In finance, MIDAS is an approach to technical analysis initiated in 1995 by the physicist and technical analyst Paul Levine, PhD, and subsequently developed by Andrew Coles, PhD, and David Hawkins in a series of articles and the book MIDAS Technical Analysis: A VWAP Approach to Trading and Investing in Today's Markets. Latterly, several important contributions to the project, including new MIDAS curves and indicators, have been made by Bob English, many of them published in the book.
The Buffett indicator is a valuation multiple used to assess how expensive or cheap the aggregate stock market is at a given point in time. It was proposed as a metric by investor Warren Buffett in 2001, who called it "probably the best single measure of where valuations stand at any given moment", and its modern form compares the capitalization of the US Wilshire 5000 index to US GDP. It is widely followed by the financial media as a valuation measure for the US market in both its absolute, and de-trended forms.
Heikin-Ashi is a Japanese trading indicator and financial chart that means "average bar". Heikin-Ashi charts resemble candlestick charts, but have a smoother appearance as they track a range of price movements, rather than tracking every price movement as with candlesticks. Heikin-Ashi was created in the 1700s by Munehisa Homma, who also created the candlestick chart. These charts are used by traders and investors to help determine and predict price movements.


