In financialtechnical analysis, a candlestick pattern is a movement in prices shown graphically on a candlestick chart that some believe can help to identify repeating patterns of a particular market movement.[1] The recognition of the pattern is subjective and programs that are used for charting have to rely on predefined rules to match the pattern.[2] There are 42 recognized patterns that can be split into simple and complex patterns.[3]
Some of the earliest technical trading analysis was used to track prices of rice in the 18th century. Much of the credit for candlestick charting goes to Munehisa Homma (1724–1803), a rice merchant from Sakata, Japan who traded in the Dojima Rice market in Osaka during the Tokugawa Shogunate. According to Steve Nison, however, candlestick charting came later, probably beginning after 1850.[4]
The most famous candlestick trader is the man who invented them, Munehisa Homma. He was a Japanese rice trader who tracked price action and saw patterns developing. He published his work in The Fountain of Gold — The Three Monkey Record of Money in 1755. In today’s dollars, he made about $10 billion.[5]
A candlestick chart (also called Japanese candlestick chart or K-line[6]) is a style of financial chart used to describe price movements of a security, derivative, or currency. Stock price prediction based on K-line patterns is the essence of candlestick technical analysis. However, there are some disputes on whether the K-line patterns have predictive power in academia.
Candlesticks are graphical representations of price movements for a given period of time.
They are commonly formed by the opening, high, low, and closing prices of a financial instrument.
If the opening price is above the closing price then a filled (normally red or black) candlestick is drawn.
If the closing price is above the opening price, then normally a green or hollow candlestick (white with black outline) is shown.
The filled or hollow portion of the candle is known as the body or real body, and can be long, normal, or short depending on its proportion to the lines above or below it.
The lines above and below, known as shadows, tails, or wicks, represent the high and low price ranges within a specified time period.
However, not all candlesticks have shadows.
Simple patterns
Big Black Candle Has an unusually long black body with a wide range between high and low. Prices open near the high and close near the low. Considered a bearish pattern.
Big White Candle Has an unusually long white body with a wide range between high and low of the day. Prices open near the low and close near the high. Considered a pattern with "bullish" market sentiment.
Black Body Formed when the opening price is higher than the closing price. Considered to be a bearish signal.
White Body Formed when the closing price is higher than the opening price and considered a bullish signal.
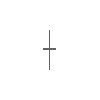
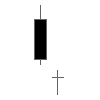
Doji Formed when opening and closing prices are virtually the same. The lengths of shadows can vary. If previous are bearish, after a Doji, may be ready to bullish.
Long-Legged Doji Consists of a Doji with very long upper and lower shadows. Indicates strong forces balanced in opposition. If previous are bullish, after long legged doji, may be ready to bearish.
Dragonfly Doji Formed when the opening and the closing prices are at the highest of the day. If it has a longer lower shadow it signals an upwards trend in price. When appearing at market bottoms it is considered to be a reversal signal.
Gravestone Doji Formed when the opening and closing prices are at the lowest of the day. If it has a longer upper shadow it signals a bearish trend. When it appears at market top it is considered a reversal signal.
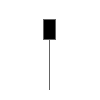
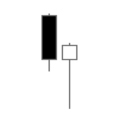
Hammer A black or white candlestick that consists of a small body near the high with little or no upper shadow and a long lower tail. Considered a bullish pattern during a downtrend.
A hammer shows that although there were selling pressures during the day, ultimately a strong buying pressure drove the price back up. The colour of the body can vary, but green hammers indicate a stronger bull market than red hammers.
Hanging Man A black or white candlestick that consists of a small body near the high with little or no upper shadow and a long lower tail. The lower tail should be two or three times the height of the body. Considered a bearish pattern during an uptrend.
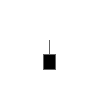
Inverted Hammer A black or white candlestick in an upside-down hammer position. Considered a bearish pattern in an uptrend.
In a downtrend, it indicates a buying pressure, followed by a selling pressure that was not strong enough to drive the market price down. The inverse hammer suggests that buyers will soon have control of the market.
Shooting Star A black or white candlestick that has a small body, a long upper shadow and little or no lower tail. Considered a bearish pattern in an uptrend.
Long Upper Shadow A black or white candlestick with an upper shadow that has a length of 2/3 or more of the total range of the candlestick. Normally considered a bearish signal when it appears around price resistance levels.
Long Lower Shadow A black or white candlestick is formed with a lower tail that has a length of 2/3 or more of the total range of the candlestick. Normally considered a bullish signal when it appears around price support levels.
Marubozu (jp: まるぼうず, 丸坊主, close-cropped head, bald hill) A long or normal candlestick (black or white) with no shadow or tail. The high and the low represent the opening and the closing prices. Considered a continuation pattern.
Spinning Top A black or white candlestick with a small body. The size of shadows can vary. Interpreted as a neutral pattern but gains importance when it is part of other formations.
Shaven Head A black or white candlestick with no upper shadow. [Compared with hammer.]
Shaven Bottom A black or white candlestick with no lower tail. [Compare with Inverted Hammer.]
Complex patterns
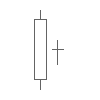
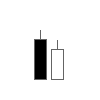
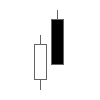
Bearish Harami Consists of an unusually large white body followed by a small black body (contained within a large white body). It is considered a bearish pattern when preceded by an uptrend.
Bullish Harami Consists of an unusually large black body followed by a small white body (contained within large black body). It is considered a bullish pattern when preceded by a downtrend.
Bearish Harami Cross A large white body followed by a Doji. Considered a reversal signal when it appears at the top.
Bullish Harami Cross A large black body followed by a Doji. It is considered a reversal signal when preceded by a downtrend.
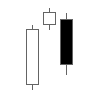
Engulfing Bearish Line Consists of a small white body that is contained within the following large black candlestick. When it appears at the top it is considered a major reversal signal.
Engulfing Bullish Consists of a small black body that is contained within the following large white candlestick. When it appears at the bottom it is interpreted as a major reversal signal.
Bearish 3-Method Formation (Also known as "Falling Three") A long black body followed by three small bodies (normally white) and a long black body. The three white bodies are contained within this jedi range of the first black body. This is considered a bearish continuation pattern.
Bullish 3-Method Formation (Also known as "Rising Three") Consists of a long white body followed by three small bodies (normally black) and a long white body. The three black bodies are contained within the range of first white body. This is considered a bullish continuation pattern.
Evening Star Consists of a large white body candlestick followed by a small body candlestick (black or white) that gaps above the previous. The third is a black body candlestick that closes well within the large white body. It is considered a reversal signal when it appears at the top level.
Evening Doji Star Consists of three candlesticks. First is a large white body candlestick followed by a Doji that gaps above the white body. The third candlestick is a black body that closes well into the white body. When it appears at the top it is considered a reversal signal. It signals a more bearish trend than the evening star pattern because of the Doji that has appeared between the two bodies.
Morning Star Consists of a large black body candlestick followed by a small body (black or white) that occurs below the large black body candlestick. On the following day, a third white body candlestick is formed that closes well into the black body candlestick. It is considered a major reversal signal when it appears at the bottom.
Morning Doji Star Consists of a large black body candlestick followed by a Doji that occurred below the preceding candlestick. On the following day, a third white body candlestick is formed that closes well into the black body candlestick which appeared before the Doji. It is considered a major reversal signal that is more bullish than the regular morning star pattern because of the existence of the Doji.
Falling Window A window (gap) is created when the high of the second candlestick is below the low of the preceding candlestick. It is considered that the window should be filled with a probable resistance.
Rising Window A window (gap) is created when the low of the second candlestick is above the high of the preceding candlestick. It is considered that the window should provide support to the selling pressure.
Three black crows Consists of three long black candlesticks with consecutively lower closes. The closing prices are near to or at their lows. When it appears at the top it is considered a top reversal signal.
Three White Soldiers Consists of three long white candlesticks with consecutively higher closes. The closing prices are near to or at their highs. When it appears at the bottom it is interpreted as a bottom reversal signal.
On Neckline In a downtrend, consists of a black candlestick followed by a small body white candlestick with its close is near the low of the preceding black candlestick. It is considered a bearish pattern when the low of the white candlestick is penetrated.
Doji Star Consists of a black or white candlestick followed by a Doji that gaps above or below these. It is considered a reversal signal with confirmation during the next trading day.
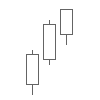
Tweezer Tops Consists of two or more candlesticks with matching tops. The candlesticks may or may not be consecutive and their sizes or colours can vary. It is considered a minor reversal signal that becomes more important when the candlesticks form another pattern.
Tweezer Bottoms Consists of two or more candlesticks with matching bottoms. The candlesticks may or may not be consecutive and their sizes or colours can vary. It is considered a minor reversal signal that becomes more important when the candlesticks form another pattern.
Dark Cloud Cover Consists of a long white candlestick followed by a black candlestick that opens above the high of the white candlestick and closes well into the body of the white candlestick. It is considered a bearish reversal signal during an uptrend.
Piercing Line Consists of a black candlestick followed by a white candlestick that opens lower than the low of the preceding but closes more than halfway into the black body candlestick. It is considered a reversal signal when it appears at the bottom.
Darth Maul The correct term for this candle is a "high wave spinning top", a small candle body with unusually large upper and lower shadows, suggesting that the prior trend has run into a period of indecision. The term "Darth Maul" comes from Star Wars, as the candle looks somewhat like a lightsaber.
Judas Candle Consists of a large black candle followed by a smaller white candle with a lower tail which is equal to the black candle in length. This is indicative of price capitulation.
Island reversal In both stock trading and financialtechnical analysis, an island reversal is a candlestick pattern with compact trading activity within a range of prices, separated from the move preceding it. A "candlestick pattern" is a movement in prices shown graphically on a candlestick chart. This separation shown on the chart, is said to be caused by an exhaustion gap and the subsequent move in the opposite direction occurs as a result of a breakaway gap.
This page is based on this Wikipedia article Text is available under the CC BY-SA 4.0 license; additional terms may apply. Images, videos and audio are available under their respective licenses.