A line chart or line graph, also known as curve chart, [1] is a type of chart that displays information as a series of data points called 'markers' connected by straight line segments. [2] It is a basic type of chart common in many fields. It is similar to a scatter plot except that the measurement points are ordered (typically by their x-axis value) and joined with straight line segments. A line chart is often used to visualize a trend in data over intervals of time – a time series – thus the line is often drawn chronologically. In these cases they are known as run charts.
Some of the earliest known line charts are generally credited to Francis Hauksbee, Nicolaus Samuel Cruquius, Johann Heinrich Lambert and William Playfair. [3]
In the experimental sciences, data collected from experiments are often visualized by a graph. For example, if one collects data on the speed of an object at certain points in time, one can visualize the data in a data table such as the following:
Elapsed Time (s) | Speed (m s−1) |
---|---|
0 | 0 |
1 | 3 |
2 | 7 |
3 | 12 |
4 | 18 |
5 | 30 |
6 | 45.6 |
Such a table representation of data is a great way to display exact values, but it can prevent the discovery and understanding of patterns in the values. In addition, a table display is often erroneously considered to be an objective, neutral collection or storage of the data (and may in that sense even be erroneously considered to be the data itself) whereas it is in fact just one of various possible visualizations of the data.
Understanding the process described by the data in the table is aided by producing a graph or line chart of speed versus time. Such a visualisation appears in the figure to the right. This visualization can let the viewer quickly understand the entire process at a glance.
This visualization can however be misunderstood, especially when expressed as showing the mathematical function that expresses the speed (the dependent variable) as a function of time . This can be misunderstood as showing speed to be a variable that is dependent only on time. This would however only be true in the case of an object being acted on only by a constant force acting in a vacuum.
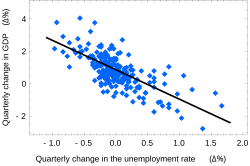
Charts often include an overlaid mathematical function depicting the best-fit trend of the scattered data. This layer is referred to as a best-fit layer and the graph containing this layer is often referred to as a line graph.
It is simple to construct a "best-fit" layer consisting of a set of line segments connecting adjacent data points; however, such a "best-fit" is usually not an ideal representation of the trend of the underlying scatter data for the following reasons:
In either case, the best-fit layer can reveal trends in the data. Further, measurements such as the gradient or the area under the curve can be made visually, leading to more conclusions or results from the data table.
A true best-fit layer should depict a continuous mathematical function whose parameters are determined by using a suitable error-minimization scheme, which appropriately weights the error in the data values. Such curve fitting functionality is often found in graphing software or spreadsheets. Best-fit curves may vary from simple linear equations to more complex quadratic, polynomial, exponential, and periodic curves. [4]
A histogram is a visual representation of the distribution of numeric data. The term was first introduced by Karl Pearson. To construct a histogram, the first step is to "bin" the range of values— divide the entire range of values into a series of intervals—and then count how many values fall into each interval. The bins are usually specified as consecutive, non-overlapping intervals of a variable. The bins (intervals) must be adjacent and are often of equal size.
In the mathematical field of numerical analysis, interpolation is a type of estimation, a method of constructing (finding) new data points based on the range of a discrete set of known data points.
Vapor pressure or equilibrium vapor pressure is the pressure exerted by a vapor in thermodynamic equilibrium with its condensed phases at a given temperature in a closed system. The equilibrium vapor pressure is an indication of a liquid's thermodynamic tendency to evaporate. It relates to the balance of particles escaping from the liquid in equilibrium with those in a coexisting vapor phase. A substance with a high vapor pressure at normal temperatures is often referred to as volatile. The pressure exhibited by vapor present above a liquid surface is known as vapor pressure. As the temperature of a liquid increases, the attractive interactions between liquid molecules become less significant in comparison to the entropy of those molecules in the gas phase, increasing the vapor pressure. Thus, liquids with strong intermolecular interactions are likely to have smaller vapor pressures, with the reverse true for weaker interactions.
In mathematics, the Euclidean distance between two points in Euclidean space is the length of the line segment between them. It can be calculated from the Cartesian coordinates of the points using the Pythagorean theorem, and therefore is occasionally called the Pythagorean distance.
The method of least squares is a parameter estimation method in regression analysis based on minimizing the sum of the squares of the residuals made in the results of each individual equation.
In science, engineering, and other quantitative disciplines, order of approximation refers to formal or informal expressions for how accurate an approximation is.
In mathematics, a time series is a series of data points indexed in time order. Most commonly, a time series is a sequence taken at successive equally spaced points in time. Thus it is a sequence of discrete-time data. Examples of time series are heights of ocean tides, counts of sunspots, and the daily closing value of the Dow Jones Industrial Average.
In mathematics and statistics, a piecewise linear, PL or segmented function is a real-valued function of a real variable, whose graph is composed of straight-line segments.
Linear trend estimation is a statistical method used to analyze data patterns. When a series of measurements of a process are treated as a sequence or time series, trend estimation can be used to make and justify statements about tendencies in the data by relating the measurements to the times at which they occurred. This model can then be used to describe the behavior of the observed data.
Curve fitting is the process of constructing a curve, or mathematical function, that has the best fit to a series of data points, possibly subject to constraints. Curve fitting can involve either interpolation, where an exact fit to the data is required, or smoothing, in which a "smooth" function is constructed that approximately fits the data. A related topic is regression analysis, which focuses more on questions of statistical inference such as how much uncertainty is present in a curve that is fitted to data observed with random errors. Fitted curves can be used as an aid for data visualization, to infer values of a function where no data are available, and to summarize the relationships among two or more variables. Extrapolation refers to the use of a fitted curve beyond the range of the observed data, and is subject to a degree of uncertainty since it may reflect the method used to construct the curve as much as it reflects the observed data.
In statistical modeling, regression analysis is a set of statistical processes for estimating the relationships between a dependent variable and one or more independent variables. The most common form of regression analysis is linear regression, in which one finds the line that most closely fits the data according to a specific mathematical criterion. For example, the method of ordinary least squares computes the unique line that minimizes the sum of squared differences between the true data and that line. For specific mathematical reasons, this allows the researcher to estimate the conditional expectation of the dependent variable when the independent variables take on a given set of values. Less common forms of regression use slightly different procedures to estimate alternative location parameters or estimate the conditional expectation across a broader collection of non-linear models.
In statistics, nonlinear regression is a form of regression analysis in which observational data are modeled by a function which is a nonlinear combination of the model parameters and depends on one or more independent variables. The data are fitted by a method of successive approximations.
Random sample consensus (RANSAC) is an iterative method to estimate parameters of a mathematical model from a set of observed data that contains outliers, when outliers are to be accorded no influence on the values of the estimates. Therefore, it also can be interpreted as an outlier detection method. It is a non-deterministic algorithm in the sense that it produces a reasonable result only with a certain probability, with this probability increasing as more iterations are allowed. The algorithm was first published by Fischler and Bolles at SRI International in 1981. They used RANSAC to solve the Location Determination Problem (LDP), where the goal is to determine the points in the space that project onto an image into a set of landmarks with known locations.
X-ray reflectivity is a surface-sensitive analytical technique used in chemistry, physics, and materials science to characterize surfaces, thin films and multilayers. It is a form of reflectometry based on the use of X-rays and is related to the techniques of neutron reflectometry and ellipsometry.
Nanoindentation, also called instrumented indentation testing, is a variety of indentation hardness tests applied to small volumes. Indentation is perhaps the most commonly applied means of testing the mechanical properties of materials. The nanoindentation technique was developed in the mid-1970s to measure the hardness of small volumes of material.
Local regression or local polynomial regression, also known as moving regression, is a generalization of the moving average and polynomial regression. Its most common methods, initially developed for scatterplot smoothing, are LOESS and LOWESS, both pronounced LOH-ess. They are two strongly related non-parametric regression methods that combine multiple regression models in a k-nearest-neighbor-based meta-model. In some fields, LOESS is known and commonly referred to as Savitzky–Golay filter.
In geometry, a polygonal chain is a connected series of line segments. More formally, a polygonal chain is a curve specified by a sequence of points called its vertices. The curve itself consists of the line segments connecting the consecutive vertices.
A plot is a graphical technique for representing a data set, usually as a graph showing the relationship between two or more variables. The plot can be drawn by hand or by a computer. In the past, sometimes mechanical or electronic plotters were used. Graphs are a visual representation of the relationship between variables, which are very useful for humans who can then quickly derive an understanding which may not have come from lists of values. Given a scale or ruler, graphs can also be used to read off the value of an unknown variable plotted as a function of a known one, but this can also be done with data presented in tabular form. Graphs of functions are used in mathematics, sciences, engineering, technology, finance, and other areas.
Linear least squares (LLS) is the least squares approximation of linear functions to data. It is a set of formulations for solving statistical problems involved in linear regression, including variants for ordinary (unweighted), weighted, and generalized (correlated) residuals. Numerical methods for linear least squares include inverting the matrix of the normal equations and orthogonal decomposition methods.
MLAB is a multi-paradigm numerical computing environment and fourth-generation programming language was originally developed at the National Institutes of Health.