Microeconomics is a branch of economics that studies the behavior of individuals and firms in making decisions regarding the allocation of scarce resources and the interactions among these individuals and firms. Microeconomics focuses on the study of individual markets, sectors, or industries as opposed to the national economy as a whole, which is studied in macroeconomics.
Taxes and subsidies change the price of goods and, as a result, the quantity consumed. There is a difference between an ad valorem tax and a specific tax or subsidy in the way it is applied to the price of the good. In the end levying a tax moves the market to a new equilibrium where the price of a good paid by buyers increases and the proportion of the price received by sellers decreases. The incidence of a tax does not depend on whether the buyers or sellers are taxed since taxes levied on sellers are likely to be met by raising the price charged to buyers. Most of the burden of a tax falls on the less elastic side of the market because of a lower ability to respond to the tax by changing the quantity sold or bought. Introduction of a subsidy, on the other hand, may either lowers the price of production which encourages firms to produce more, or lowers the price paid by buyers, encouraging higher sales volume. Such a policy is beneficial both to sellers and buyers.

In economics, deadweight loss is the difference in production and consumption of any given product or service including government tax. The presence of deadweight loss is most commonly identified when the quantity produced relative to the amount consumed differs in regards to the optimal concentration of surplus. This difference in the amount reflects the quantity that is not being utilized or consumed and thus resulting in a loss. This "deadweight loss" is therefore attributed to both producers and consumers because neither one of them benefits from the surplus of the overall production.
A market trend is a perceived tendency of the financial markets to move in a particular direction over time. Analysts classify these trends as secular for long time-frames, primary for medium time-frames, and secondary for short time-frames. Traders attempt to identify market trends using technical analysis, a framework which characterizes market trends as predictable price tendencies within the market when price reaches support and resistance levels, varying over time.

In finance, a dead cat bounce is a small, brief recovery in the price of a declining stock. Derived from the idea that "even a dead cat will bounce if it falls from a great height", the phrase is also popularly applied to any case where a subject experiences a brief resurgence during or following a severe decline. This may also be known as a "sucker rally".
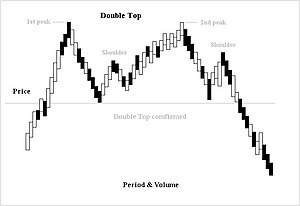
A chart pattern or price pattern is a pattern within a chart when prices are graphed. In stock and commodity markets trading, chart pattern studies play a large role during technical analysis. When data is plotted there is usually a pattern which naturally occurs and repeats over a period. Chart patterns are used as either reversal or continuation signals.
In economics, a price mechanism is the manner in which the profits of goods or services affects the supply and demand of goods and services, principally by the price elasticity of demand. A price mechanism affects both buyer and seller who negotiate prices. A price mechanism, part of a market system, comprises various ways to match up buyers and sellers.

In economics, a shortage or excess demand is a situation in which the demand for a product or service exceeds its supply in a market. It is the opposite of an excess supply (surplus).
In economics, tax incidence or tax burden is the effect of a particular tax on the distribution of economic welfare. Economists distinguish between the entities who ultimately bear the tax burden and those on whom the tax is initially imposed. The tax burden measures the true economic effect of the tax, measured by the difference between real incomes or utilities before and after imposing the tax, and taking into account how the tax causes prices to change. For example, if a 10% tax is imposed on sellers of butter, but the market price rises 8% as a result, most of the tax burden is on buyers, not sellers. The concept of tax incidence was initially brought to economists' attention by the French Physiocrats, in particular François Quesnay, who argued that the incidence of all taxation falls ultimately on landowners and is at the expense of land rent. Tax incidence is said to "fall" upon the group that ultimately bears the burden of, or ultimately suffers a loss from, the tax. The key concept of tax incidence is that the tax incidence or tax burden does not depend on where the revenue is collected, but on the price elasticity of demand and price elasticity of supply. As a general policy matter, the tax incidence should not violate the principles of a desirable tax system, especially fairness and transparency. The concept of tax incidence is used in political science and sociology to analyze the level of resources extracted from each income social stratum in order to describe how the tax burden is distributed among social classes. That allows one to derive some inferences about the progressive nature of the tax system, according to principles of vertical equity.

A double auction is a process of buying and selling goods with multiple sellers and multiple buyers. Potential buyers submit their bids and potential sellers submit their ask prices to the market institution, and then the market institution chooses some price p that clears the market: all the sellers who asked less than p sell and all buyers who bid more than p buy at this price p. Buyers and sellers that bid or ask for exactly p are also included. A common example of a double auction is stock exchange.
On the technical analysis chart, the head and shoulders formation occurs when a market trend is in the process of reversal either from a bullish or bearish trend; a characteristic pattern takes shape and is recognized as reversal formation.
On the technical analysis chart, a wedge pattern is a market trend commonly found in traded assets. The pattern is characterized by a contracting range in prices coupled with an upward trend in prices or a downward trend in prices.
The doji is a commonly found pattern in a candlestick chart of financially traded assets in technical analysis. It is characterized by being small in length—meaning a small trading range—with an opening and closing price that are virtually equal. The efficacy of technical analysis is disputed by the efficient-market hypothesis, which states that stock market prices are essentially unpredictable.

The Morning Star is a pattern seen in a candlestick chart, a popular type of a chart used by technical analysts to anticipate or predict price action of a security, derivative, or currency over a short period of time.
In economics, an excess supply, economic surplus market surplus or briefly supply is a situation in which the quantity of a good or service supplied is more than the quantity demanded, and the price is above the equilibrium level determined by supply and demand. That is, the quantity of the product that producers wish to sell exceeds the quantity that potential buyers are willing to buy at the prevailing price. It is the opposite of an economic shortage.
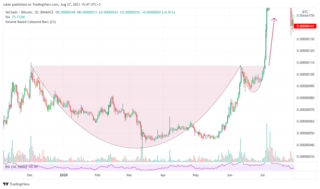
In the domain of technical analysis of market prices, a cup and handle or cup with handle formation is a chart pattern consisting of a drop in the price and a rise back up to the original value, followed first by a smaller drop and then a rise past the previous peak. It is interpreted as an indication of bullish sentiment in the market and possible further price increases.
Broadening top is technical analysis chart pattern describing trends of stocks, commodities, currencies, and other assets. Broadening Top formation appears much more frequently at tops than at bottoms. Its formation usually has bearish implications.
Triple top and triple bottom are reversal chart patterns used in the technical analysis of stocks, commodities, currencies, and other assets.

In both stock trading and financial technical analysis, an island reversal is a candlestick pattern with compact trading activity within a range of prices, separated from the move preceding it. A "candlestick pattern" is a movement in prices shown graphically on a candlestick chart. This separation shown on the chart, is said to be caused by an exhaustion gap and the subsequent move in the opposite direction occurs as a result of a breakaway gap.
Price action is a method of analysis of the basic price movements to generate trade entry and exit signals that is considered reliable while not requiring the use of indicators. It is a form of technical analysis, as it ignores the fundamental factors of a security and looks primarily at the security's price history. However, this method is different from other forms of technical analysis, as it focuses on the relation of the security's current price to its price history, which consists of all price movements, as opposed to values derived from the price history.