A fast Fourier transform (FFT) is an algorithm that computes the discrete Fourier transform (DFT) of a sequence, or its inverse (IDFT). Fourier analysis converts a signal from its original domain to a representation in the frequency domain and vice versa. The DFT is obtained by decomposing a sequence of values into components of different frequencies. This operation is useful in many fields, but computing it directly from the definition is often too slow to be practical. An FFT rapidly computes such transformations by factorizing the DFT matrix into a product of sparse factors. As a result, it manages to reduce the complexity of computing the DFT from , which arises if one simply applies the definition of DFT, to , where is the data size. The difference in speed can be enormous, especially for long data sets where N may be in the thousands or millions. In the presence of round-off error, many FFT algorithms are much more accurate than evaluating the DFT definition directly. There are many different FFT algorithms based on a wide range of published theories, from simple complex-number arithmetic to group theory and number theory.

In descriptive statistics, a box plot or boxplot is a method for graphically depicting groups of numerical data through their quartiles. Box plots may also have lines extending vertically from the boxes (whiskers) indicating variability outside the upper and lower quartiles, hence the terms box-and-whisker plot and box-and-whisker diagram. Outliers may be plotted as individual points. Box plots are non-parametric: they display variation in samples of a statistical population without making any assumptions of the underlying statistical distribution. The spacings between the different parts of the box indicate the degree of dispersion (spread) and skewness in the data, and show outliers. In addition to the points themselves, they allow one to visually estimate various L-estimators, notably the interquartile range, midhinge, range, mid-range, and trimean. Box plots can be drawn either horizontally or vertically. Box plots received their name from the box in the middle.
Nonparametric statistics is the branch of statistics that is not based solely on parametrized families of probability distributions. Nonparametric statistics is based on either being distribution-free or having a specified distribution but with the distribution's parameters unspecified. Nonparametric statistics includes both descriptive statistics and statistical inference.
The Cooley–Tukey algorithm, named after J. W. Cooley and John Tukey, is the most common fast Fourier transform (FFT) algorithm. It re-expresses the discrete Fourier transform (DFT) of an arbitrary composite size N = N1N2 in terms of N1 smaller DFTs of sizes N2, recursively, to reduce the computation time to O(N log N) for highly composite N. Because of the algorithm's importance, specific variants and implementation styles have become known by their own names, as described below.
In statistics, exploratory data analysis (EDA) is an approach to analyzing data sets to summarize their main characteristics, often with visual methods. A statistical model can be used or not, but primarily EDA is for seeing what the data can tell us beyond the formal modeling or hypothesis testing task. Exploratory data analysis was promoted by John Tukey to encourage statisticians to explore the data, and possibly formulate hypotheses that could lead to new data collection and experiments. EDA is different from initial data analysis (IDA), which focuses more narrowly on checking assumptions required for model fitting and hypothesis testing, and handling missing values and making transformations of variables as needed. EDA encompasses IDA.
In statistics, resampling is any of a variety of methods for doing one of the following:
- Estimating the precision of sample statistics by using subsets of available data (jackknifing) or drawing randomly with replacement from a set of data points (bootstrapping)
- Exchanging labels on data points when performing significance tests
- Validating models by using random subsets
Sidney Siegel was an American psychologist who became especially well known for his work in popularising non-parametric statistics for use in the behavioural sciences. He was a co-developer of the statistical test known as the Siegel–Tukey test.
In statistics, family-wise error rate (FWER) is the probability of making one or more false discoveries, or type I errors when performing multiple hypotheses tests.
In statistics, the jackknife is a resampling technique especially useful for variance and bias estimation. The jackknife pre-dates other common resampling methods such as the bootstrap. The jackknife estimator of a parameter is found by systematically leaving out each observation from a dataset and calculating the estimate and then finding the average of these calculations. Given a sample of size , the jackknife estimate is found by aggregating the estimates of each -sized sub-sample.
In statistics, the studentized range is the difference between the largest and smallest data in a sample measured in units of sample standard deviations.
Tukey's range test, also known as the Tukey's test, Tukey method, Tukey's honest significance test, or Tukey's HSD test, is a single-step multiple comparison procedure and statistical test. It can be used on raw data or in conjunction with an ANOVA to find means that are significantly different from each other. Named after John Tukey, it compares all possible pairs of means, and is based on a studentized range distribution (q). The Tukey HSD tests should not be confused with the Tukey Mean Difference tests.
Francis John "Frank" Anscombe was an English statistician.
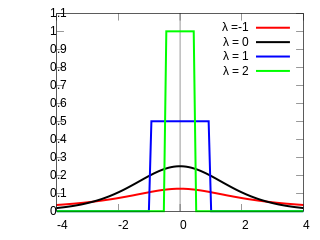
Formalized by John Tukey, the Tukey lambda distribution is a continuous, symmetric probability distribution defined in terms of its quantile function. It is typically used to identify an appropriate distribution and not used in statistical models directly.
In statistical theory, a U-statistic is a class of statistics that is especially important in estimation theory; the letter "U" stands for unbiased. In elementary statistics, U-statistics arise naturally in producing minimum-variance unbiased estimators.
Statistics is the theory and application of mathematics to the scientific method including hypothesis generation, experimental design, sampling, data collection, data summarization, estimation, prediction and inference from those results to the population from which the experimental sample was drawn. This article lists statisticians who have been instrumental in the development of theoretical and applied statistics.
The Newman–Keuls or Student–Newman–Keuls (SNK) method is a stepwise multiple comparisons procedure used to identify sample means that are significantly different from each other. It was named after Student (1927), D. Newman, and M. Keuls. This procedure is often used as a post-hoc test whenever a significant difference between three or more sample means has been revealed by an analysis of variance (ANOVA). The Newman–Keuls method is similar to Tukey's range test as both procedures use studentized range statistics. Unlike Tukey's range test, the Newman–Keuls method uses different critical values for different pairs of mean comparisons. Thus, the procedure is more likely to reveal significant differences between group means and to commit type I errors by incorrectly rejecting a null hypothesis when it is true. In other words, the Neuman-Keuls procedure is more powerful but less conservative than Tukey's range test.
In statistics, Tukey's test of additivity, named for John Tukey, is an approach used in two-way ANOVA to assess whether the factor variables are additively related to the expected value of the response variable. It can be applied when there are no replicated values in the data set, a situation in which it is impossible to directly estimate a fully general non-additive regression structure and still have information left to estimate the error variance. The test statistic proposed by Tukey has one degree of freedom under the null hypothesis, hence this is often called "Tukey's one-degree-of-freedom test."

A bagplot, or starburst plot, is a method in robust statistics for visualizing two- or three-dimensional statistical data, analogous to the one-dimensional box plot. Introduced in 1999 by Rousseuw et al., the bagplot allows one to visualize the location, spread, skewness, and outliers of a data set.