In geometry, an affine transformation, affine map or an affinity is a function between affine spaces which preserves points, straight lines and planes. Also, sets of parallel lines remain parallel after an affine transformation. An affine transformation does not necessarily preserve angles between lines or distances between points, though it does preserve ratios of distances between points lying on a straight line.

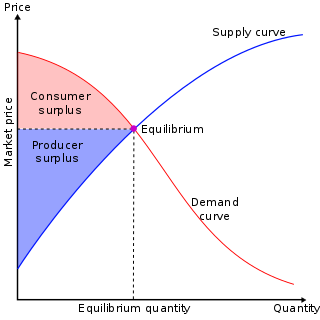
In mainstream economics, economic surplus, also known as total welfare or Marshallian surplus, refers to two related quantities. Consumer surplus or consumers' surplus is the monetary gain obtained by consumers because they are able to purchase a product for a price that is less than the highest price that they would be willing to pay. Producer surplus or producers' surplus is the amount that producers benefit by selling at a market price that is higher than the least that they would be willing to sell for; this is roughly equal to profit.
In economics, profit maximization is the short run or long run process by which a firm may determine the price, input, and output levels that lead to the greatest profit. Neoclassical economics, currently the mainstream approach to microeconomics, usually models the firm as maximizing profit.
In economics, elasticity is the measurement of the proportional change of an economic variable in response to a change in another. It shows how easy it is for the supplier and consumer to change their behavior and substitute another good, the strength of an incentive over choices per the relative opportunity cost.
Price elasticity of demand is a measure used in economics to show the responsiveness, or elasticity, of the quantity demanded of a good or service to a change in its price when nothing but the price changes. More precisely, it gives the percentage change in quantity demanded in response to a one percent change in price.

The break-even point (BEP) in economics, business—and specifically cost accounting—is the point at which total cost and total revenue are equal, i.e. "even". There is no net loss or gain, and one has "broken even", though opportunity costs have been paid and capital has received the risk-adjusted, expected return. In short, all costs that must be paid are paid, and there is neither profit nor loss.

In economics, marginal cost is the change in the total cost that arises when the quantity produced is incremented by one unit; that is, it is the cost of producing one more unit of a good. Intuitively, marginal cost at each level of production includes the cost of any additional inputs required to produce the next unit. At each level of production and time period being considered, marginal costs include all costs that vary with the level of production, whereas other costs that do not vary with production are fixed and thus have no marginal cost. For example, the marginal cost of producing an automobile will generally include the costs of labor and parts needed for the additional automobile but not the fixed costs of the factory that have already been incurred. In practice, marginal analysis is segregated into short and long-run cases, so that, over the long run, all costs become marginal. Where there are economies of scale, prices set at marginal cost will fail to cover total costs, thus requiring a subsidy. Marginal cost pricing is not a matter of merely lowering the general level of prices with the aid of a subsidy; with or without subsidy it calls for a drastic restructuring of pricing practices, with opportunities for very substantial improvements in efficiency at critical points.

In economics, a production function gives the technological relation between quantities of physical inputs and quantities of output of goods. The production function is one of the key concepts of mainstream neoclassical theories, used to define marginal product and to distinguish allocative efficiency, a key focus of economics. One important purpose of the production function is to address allocative efficiency in the use of factor inputs in production and the resulting distribution of income to those factors, while abstracting away from the technological problems of achieving technical efficiency, as an engineer or professional manager might understand it.
In economics, average cost or unit cost is equal to total cost (TC) divided by the number of units of a good produced :
In inventory management, economic order quantity (EOQ) is the order quantity that minimizes the total holding costs and ordering costs. It is one of the oldest classical production scheduling models. The model was developed by Ford W. Harris in 1913, but R. H. Wilson, a consultant who applied it extensively, and K. Andler are given credit for their in-depth analysis.
In economics, a cost curve is a graph of the costs of production as a function of total quantity produced. In a free market economy, productively efficient firms optimize their production process by minimizing cost consistent with each possible level of production, and the result is a cost curve; and profit maximizing firms use cost curves to decide output quantities. There are various types of cost curves, all related to each other, including total and average cost curves; marginal cost curves, which are equal to the differential of the total cost curves; and variable cost curves. Some are applicable to the short run, others to the long run.

In economics, total cost (TC) is the total economic cost of production and is made up of variable cost, which varies according to the quantity of a good produced and includes inputs such as labour and raw materials, plus fixed cost, which is independent of the quantity of a good produced and includes inputs that cannot be varied in the short term: fixed costs such as buildings and machinery, including sunk costs if any. Since cost is measured per unit of time, it is a flow variable.
In monetary economics, the equation of exchange is the relation:
The newsvendormodel is a mathematical model in operations management and applied economics used to determine optimal inventory levels. It is (typically) characterized by fixed prices and uncertain demand for a perishable product. If the inventory level is , each unit of demand above is lost in potential sales. This model is also known as the newsvendor problem or newsboy problem by analogy with the situation faced by a newspaper vendor who must decide how many copies of the day's paper to stock in the face of uncertain demand and knowing that unsold copies will be worthless at the end of the day.
The economic production quantity model determines the quantity a company or retailer should order to minimize the total inventory costs by balancing the inventory holding cost and average fixed ordering cost. The EPQ model was developed by E.W. Taft in 1918. This method is an extension of the economic order quantity model. The difference between these two methods is that the EPQ model assumes the company will produce its own quantity or the parts are going to be shipped to the company while they are being produced, therefore the orders are available or received in an incremental manner while the products are being produced. While the EOQ model assumes the order quantity arrives complete and immediately after ordering, meaning that the parts are produced by another company and are ready to be shipped when the order is placed.
In economics, supply is the amount of a resource that firms, producers, labourers, providers of financial assets, or other economic agents are willing and able to provide to the marketplace or directly to another agent in the marketplace. Supply can be in currency, time, raw materials, or any other scarce or valuable object that can be provided to another agent. This is often fairly abstract. For example in the case of time, supply is not transferred to one agent from another, but one agent may offer some other resource in exchange for the first spending time doing something. Supply is often plotted graphically with the quantity provided plotted horizontally and the price plotted vertically.

Cost–volume–profit (CVP), in managerial economics, is a form of cost accounting. It is a simplified model, useful for elementary instruction and for short-run decisions.
The profit model is the linear, deterministic algebraic model used implicitly by most cost accountants. Starting with, profit equals sales minus costs, it provides a structure for modeling cost elements such as materials, losses, multi-products, learning, depreciation etc. It provides a mutable conceptual base for spreadsheet modelers. This enables them to run deterministic simulations or 'what if' modelling to see the impact of price, cost or quantity changes on profitability.


