Zero degrees of freedom

Last updated

In statistics, the non-central chi-squared distribution with zero degrees of freedom can be used in testing the null hypothesis that a sample is from a uniform distribution on the interval (0, 1). This distribution was introduced by Andrew F. Siegel in 1979. [1]

Statistics study of the collection, organization, analysis, interpretation, and presentation of data

Statistics is a branch of mathematics dealing with data collection, organization, analysis, interpretation and presentation. In applying statistics to, for example, a scientific, industrial, or social problem, it is conventional to begin with a statistical population or a statistical model process to be studied. Populations can be diverse topics such as "all people living in a country" or "every atom composing a crystal". Statistics deals with all aspects of data, including the planning of data collection in terms of the design of surveys and experiments. See glossary of probability and statistics.

A statistical hypothesis, sometimes called confirmatory data analysis, is a hypothesis that is testable on the basis of observing a process that is modeled via a set of random variables. A statistical hypothesis test is a method of statistical inference. Commonly, two statistical data sets are compared, or a data set obtained by sampling is compared against a synthetic data set from an idealized model. A hypothesis is proposed for the statistical relationship between the two data sets, and this is compared as an alternative to an idealized null hypothesis that proposes no relationship between two data sets. The comparison is deemed statistically significant if the relationship between the data sets would be an unlikely realization of the null hypothesis according to a threshold probability—the significance level. Hypothesis tests are used in determining what outcomes of a study would lead to a rejection of the null hypothesis for a pre-specified level of significance. The process of distinguishing between the null hypothesis and the alternative hypothesis is aided by identifying two conceptual types of errors. The first type occurs when the null hypothesis is falsely rejected. The second type of error occurs when the null hypothesis is falsely assumed to be true. By specifying a threshold probability ('alpha') on, e.g., the admissible risk of making a type 1 error, the statistical decision process can be controlled.

Null hypothesis

In inferential statistics, the null hypothesis is a general statement or default position that there is no relationship between two measured phenomena, or no association among groups. Testing the null hypothesis—and thus concluding that there are or are not grounds for believing that there is a relationship between two phenomena —is a central task in the modern practice of science; the field of statistics gives precise criteria for rejecting a null hypothesis.

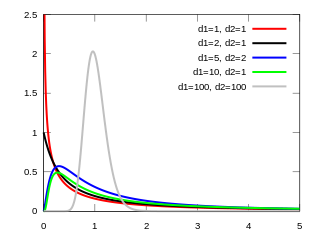
The chi-squared distribution with n degrees of freedom is the probability distribution of the sum

Chi-squared distribution gamma distribution

In probability theory and statistics, the chi-squared distribution with k degrees of freedom is the distribution of a sum of the squares of k independent standard normal random variables. The chi-square distribution is a special case of the gamma distribution and is one of the most widely used probability distributions in inferential statistics, notably in hypothesis testing or in construction of confidence intervals. When it is being distinguished from the more general noncentral chi-squared distribution, this distribution is sometimes called the central chi-squared distribution.

In probability theory and statistics, a probability distribution is a mathematical function that provides the probabilities of occurrence of different possible outcomes in an experiment. In more technical terms, the probability distribution is a description of a random phenomenon in terms of the probabilities of events. For instance, if the random variable X is used to denote the outcome of a coin toss, then the probability distribution of X would take the value 0.5 for X = heads, and 0.5 for X = tails. Examples of random phenomena can include the results of an experiment or survey.

where

However, if

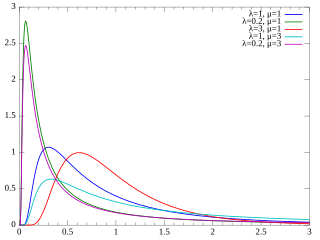
and are independent, then the sum of squares above has a non-central chi-squared distribution with n degrees of freedom and "noncentrality parameter"

It is trivial that a "central" chi-square distribution with zero degrees of freedom concentrates all probability at zero.

All of this leaves open the question of what happens with zero degrees of freedom when the noncentrality parameter is not zero.

The noncentral chi-squared distribution with zero degrees of freedom and with noncentrality parameter μ is the distribution of

This concentrates probability eμ/2 at zero; thus it is a mixture of discrete and continuous distributions

Related Research Articles

Normal distribution probability distribution

In probability theory, the normaldistribution is a very common continuous probability distribution. Normal distributions are important in statistics and are often used in the natural and social sciences to represent real-valued random variables whose distributions are not known. A random variable with a Gaussian distribution is said to be normally distributed and is called a normal deviate.

Multivariate normal distribution

In probability theory and statistics, the multivariate normal distribution, multivariate Gaussian distribution, or joint normal distribution is a generalization of the one-dimensional (univariate) normal distribution to higher dimensions. One definition is that a random vector is said to be k-variate normally distributed if every linear combination of its k components has a univariate normal distribution. Its importance derives mainly from the multivariate central limit theorem. The multivariate normal distribution is often used to describe, at least approximately, any set of (possibly) correlated real-valued random variables each of which clusters around a mean value.

Students <i>t</i>-distribution probability distribution

In probability and statistics, Student's t-distribution is any member of a family of continuous probability distributions that arises when estimating the mean of a normally distributed population in situations where the sample size is small and population standard deviation is unknown. It was developed by William Sealy Gosset under the pseudonym Student.

In statistics, maximum likelihood estimation (MLE) is a method of estimating the parameters of a statistical model, given observations. The method obtains the parameter estimates by finding the parameter values that maximize the likelihood function. The estimates are called maximum likelihood estimates, which is also abbreviated as MLE.

Erlang distribution

The Erlang distribution is a two-parameter family of continuous probability distributions with support . The two parameters are:

<i>F</i>-distribution continuous probability distribution

In probability theory and statistics, the F-distribution, also known as Snedecor's F distribution or the Fisher–Snedecor distribution is a continuous probability distribution that arises frequently as the null distribution of a test statistic, most notably in the analysis of variance (ANOVA), e.g., F-test.

In statistics, Cochran's theorem, devised by William G. Cochran, is a theorem used to justify results relating to the probability distributions of statistics that are used in the analysis of variance.

In probability theory, a compound Poisson distribution is the probability distribution of the sum of a number of independent identically-distributed random variables, where the number of terms to be added is itself a Poisson-distributed variable. In the simplest cases, the result can be either a continuous or a discrete distribution.

Rice distribution probability distribution of the magnitude of a circular bivariate normal random variable

In probability theory, the Rice distribution, Rician distribution or Ricean distribution is the probability distribution of the magnitude of a circular bivariate normal random variable with potentially non-zero mean. It was named after Stephen O. Rice.

Chi distribution

In probability theory and statistics, the chi distribution is a continuous probability distribution. It is the distribution of the positive square root of the sum of squares of a set of independent random variables each following a standard normal distribution, or equivalently, the distribution of the Euclidean distance of the random variables from the origin. It is thus related to the chi-squared distribution by describing the distribution of the positive square roots of a variable obeying a chi-squared distribution.

Noncentral chi-squared distribution

In probability theory and statistics, the noncentral chi-squared or noncentral distribution is a generalization of the chi-squared distribution. This distribution often arises in the power analysis of statistical tests in which the null distribution is a chi-squared distribution; important examples of such tests are the likelihood-ratio tests.

In probability theory and statistics, the noncentral chi distribution is a generalization of the chi distribution. If are k independent, normally distributed random variables with means and variances , then the statistic

Inverse Gaussian distribution

In probability theory, the inverse Gaussian distribution is a two-parameter family of continuous probability distributions with support on (0,∞).

In statistics, the bias of an estimator is the difference between this estimator's expected value and the true value of the parameter being estimated. An estimator or decision rule with zero bias is called unbiased. Otherwise the estimator is said to be biased. In statistics, "bias" is an objective property of an estimator, and while not a desired property, it is not pejorative, unlike the ordinary English use of the term "bias".

In probability and statistics, a natural exponential family (NEF) is a class of probability distributions that is a special case of an exponential family (EF). Every distribution possessing a moment-generating function is a member of a natural exponential family, and the use of such distributions simplifies the theory and computation of generalized linear models.

Poisson distribution discrete probability distribution

In probability theory and statistics, the Poisson distribution, named after French mathematician Siméon Denis Poisson, is a discrete probability distribution that expresses the probability of a given number of events occurring in a fixed interval of time or space if these events occur with a known constant rate and independently of the time since the last event. The Poisson distribution can also be used for the number of events in other specified intervals such as distance, area or volume.

In probability theory and statistics, the negative multinomial distribution is a generalization of the negative binomial distribution to more than two outcomes.

In probability theory and statistics, the noncentral beta distribution is a continuous probability distribution that is a generalization of the (central) beta distribution.

Hermite distribution

In probability theory and statistics, the Hermite distribution, named after Charles Hermite, is a discrete probability distribution used to model count data with more than one parameter. This distribution is flexible in terms of its ability to allow a moderate over-dispersion in the data.

References

  1. Siegel, A. F. (1979), "The noncentral chi-squared distribution with zero degrees of freedom and testing for uniformity", Biometrika , 66, 381–386