Related Research Articles

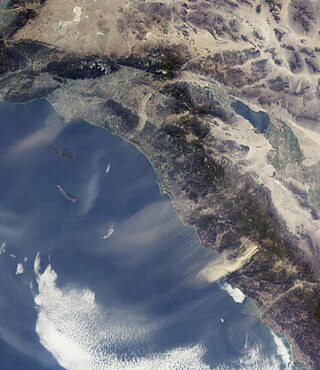
The Santa Ana winds are strong, extremely dry downslope winds that originate inland and affect coastal Southern California and northern Baja California. They originate from cool, dry high-pressure air masses in the Great Basin.

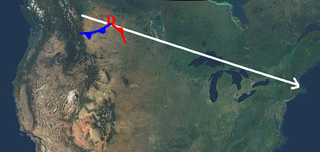
An Alberta clipper, also known as an Alberta low, Alberta cyclone, Alberta lee cyclone, Canadian clipper, or simply clipper, is a fast-moving low-pressure system that originates in or near the Canadian province of Alberta just east of the Rocky Mountains and tracks east-southeastward across southern Canada and the northern United States to the North Atlantic Ocean.

A period of unusually hot summer weather occurred in the British Isles during the summer of 1976. At the same time, there was a severe drought on the islands of Great Britain and Ireland. It was one of the driest, sunniest and warmest summers (June/July/August) in the 20th century, although the summer of 1995 is now regarded as the driest. Only a few places registered more than half their average summer rainfall. In the Central England temperature record, it was the warmest summer in the series until being surpassed in the 21st century. It was the warmest summer in the Aberdeen area since at least 1864, and the driest summer since 1868 in Glasgow.

Blocks in meteorology are large-scale patterns in the atmospheric pressure field that are nearly stationary, effectively "blocking" or redirecting migratory cyclones. They are also known as blocking highs or blocking anticyclones. These blocks can remain in place for several days or even weeks, causing the areas affected by them to have the same kind of weather for an extended period of time. In the Northern Hemisphere, extended blocking occurs most frequently in the spring over the eastern Pacific and Atlantic Oceans. Whilst these events are linked to the occurrence of extreme weather events such as heat waves, particularly the onset and decay of these events is still not well captured in numerical weather forecasts and remains an open area of research.

The climate of the city of Sydney, Australia is humid subtropical, shifting from mild and cool in winter to warm and hot in the summer, with no extreme seasonal differences as the weather is moderated by proximity to the ocean, although more contrasting temperatures are recorded in the inland western suburbs. Despite the fact that there is no distinct dry or wet season, rainfall peaks in the first few months of the year and is at its lowest just around the middle of the year, though precipitation can be erratic throughout the year. Precipitation varies across the region, with areas adjacent to the coast being the wettest. According to the Bureau of Meteorology, Sydney falls in the temperate climate zone which has warm to hot summers and no dry season. Sydney's plant hardiness zone ranges from zone 11a to 9b throughout the metropolitan area.

Minnesota has a humid continental climate, with hot summers and cold winters. Minnesota's location in the Upper Midwest allows it to experience some of the widest variety of weather in the United States, with each of the four seasons having its own distinct characteristics. The area near Lake Superior in the Minnesota Arrowhead region experiences weather unique from the rest of the state. The moderating effect of Lake Superior keeps the surrounding area relatively cooler in the summer and warmer in the winter, giving that region a smaller yearly temperature variation. On the Köppen climate classification, much of the southern third of Minnesota—roughly from the Twin Cities region southward—falls in the hot summer zone (Dfa), and the northern two-thirds of Minnesota falls in the warm summer zone (Dfb).

Drought in Australia is defined by the Australian Bureau of Meteorology as rainfall over period greater than three-months being in the lowest decile of what has been recorded for that region in the past. This definition takes into account that drought is a relative term and rainfall deficiencies need to be compared to typical rainfall patterns including seasonal variations. Specifically, drought in Australia is defined in relation to a rainfall deficiency of pastoral leases and is determined by decile analysis applied to a certain area. Note that this definition uses rainfall only because long-term records are widely available across most of Australia. However, it does not take into account other variables that might be important for establishing surface water balance, such as evaporation and condensation.
The 2007 North American heat wave started at the end of July and lasted into the first weeks of August. It was associated with severe drought over regions of the southeastern United States and parts of the Great Lakes region.

The United States' contiguous western and especially southwestern region has experienced widespread drought since about year 2000. Below normal precipitation leads to drought, and is caused by an above average persistence of high pressure over the affected area. Changes in the track of extratropical cyclones, which can occur during climate cycles such as the El Niño-Southern Oscillation, or ENSO, as well as the North Atlantic Oscillation, Pacific Decadal Oscillation, and Atlantic multidecadal oscillation, modulate which areas are more prone to drought. Increased drought frequency and severity is also expected to be one of the effects of global warming.

Pakistan's climate is a continental type of climate, characterized by extreme variations in temperature, both seasonally and daily, because it is located on a great landmass north of the Tropic of Cancer.


Droughts are a relatively common feature of the weather in the United Kingdom, with one around every 5–10 years on average. These droughts are usually during the summer, when a blocking high causes hot, dry weather for an extended period. However this means that droughts can vary in their characteristics. All types of drought cause issues across all sectors, with impacts extending to the ecosystem, agriculture and the economy of the whole country in severe cases of drought. The south east of the country usually suffers most, as it has the highest population and the lowest average precipitation per year, which is even lower in a drought. Even in these areas in severe droughts, the definition, impacts, effects and management are all minimal in comparison to drought prone areas such as Australia and parts of the United States. In recent years however, the summers of 2007, 2008, 2009, August 2010 and 2012 were wetter than normal, 2007 being wettest on record.

The Summer 2012 North American heat wave was one of the most severe heat waves in modern North American history. It resulted in more than 82 heat-related deaths across the United States and Canada, and an additional twenty-two people died in the resultant June 2012 North American derecho. This long-lived, straight-line wind and its thunderstorms cut electrical power to 3.7 million customers. Over 500,000 were still without power on July 6, as the heat wave continued. Temperatures generally decreased somewhat the week of July 9 in the east, but the high pressure shifted to the west, causing the core of the hot weather to build in the Mountain States and the Southwestern United States shifting eastwards again by mid-July. By early August, the core of the heat remained over the Southern Plains.

The 2012–2013 North American drought, an expansion of the 2010–2013 Southern United States drought, originated in the midst of a record-breaking heat wave. Low snowfall amounts in winter, coupled with the intense summer heat from La Niña, caused drought-like conditions to migrate northward from the southern United States, wreaking havoc on crops and water supply. The drought inflicted significant economic ramifications for the affected states. It exceeded, in many measures, the 1988–1989 North American drought, the most recent comparable drought.
The 1901 eastern United States heat wave was the most severe and deadly heat wave in the United States prior to the 1930s Dust Bowl. Although the heat wave did not set many still-standing daily temperature records, it was exceptionally prolonged – covering without interruption the second half of June and all of July – and centered upon more highly populated areas than later American heat waves. The heat wave accompanied a major drought in the Ohio Valley and Upper Midwest, with Illinois recording what remains its driest calendar year since records have been kept, and Missouri receiving only 0.21 inches (5.3 mm) above its driest calendar year of 1953.

The 2018 Britain and Ireland heat wave was a period of unusually hot weather that took place in June, July and August. It caused widespread drought, hosepipe bans, crop failures, and a number of wildfires. These wildfires worst affected northern moorland areas around the Greater Manchester region, the largest was at Saddleworth Moor and another was at Winter Hill, together these burned over 14 square miles (36 km2) of land over a period of nearly a month.

A drought developed in the Western, Midwestern, and Northeastern United States in the summer of 2020. Similar conditions started in other states in August 2020, including Iowa, Nebraska and certain parts of Wisconsin and Minnesota. At the same time, more than 90% of Utah, Colorado, Nevada and New Mexico were in some levels of drought. Also in drought conditions were Wyoming, Oregon and Arizona.

This page documents notable heat waves worldwide in 2022. Many heat waves were worsened by climate change and its effects. Notably, heat waves across Europe, which also affected the United Kingdom, started in June and continued throughout July into August. They caused continent-wide wildfires, with thousands dying due to heat-related causes. Other heat waves have been felt throughout the year, including in the Americas, China, Australia and the Indian subcontinent.
Excessive heat and drought problems affected the United States in 1934–35 from the Rocky Mountains, Texas and Oklahoma to parts of the Midwestern, Great Lakes and Middle Atlantic States. These droughts and excessive heat spells were parts of the Dust Bowl and concurrent with the Great Depression in the United States.
References
- ↑ Stevens, William K. (10 November 1985). "Outside of NYC, Drought is Fading". The New York Times. Retrieved May 12, 2022.
- ↑ Xeflide, Seth (January 2010). "A 1983-84 La Niña Animation". The Physical Sciences Laboratory. Retrieved May 12, 2022.
- ↑ Malcolm, Andrew H. (1983-09-03). "U.S. Drought Disaster Declared by U.S." New York Times. Retrieved 2009-04-13.
- ↑ "Droughts in Illinois" (PDF). NWS. Retrieved March 30, 2013.[ permanent dead link ]
- ↑ "The Top Ten Heat Events". NOAA. Retrieved 2009-04-20.
- ↑ Xeflide, Seth (January 2010). "The Surface Water Resource Potential of New Jersey". The Montclair State University. Retrieved May 12, 2022.
- 1 2 Chinook(PDF). Summer 1984 http://cmosarchives.ca/Chinook/ch0603.pdf . Retrieved May 12, 2022.
{{cite magazine}}: Missing or empty|title=(help) - ↑ The National Climate Program Act and Climate Change. Washington DC: US Government Printing Office. 1988. Retrieved May 14, 2022.
- ↑ "St. Louis Bears Brunt of Heat Wave as U.S. Toll Rises". New York Times. 24 July 1983. Retrieved 2009-04-15.
- ↑ "The 1983 Drought". Globalenergy. Retrieved Sep 4, 2019.
- ↑ "The Great Drought of 1983". UPI. Retrieved November 28, 2016.
- ↑ Joe Lauer (19 July 2012). "Will We Have Enough Corn". WCM newsletter. Retrieved Dec 12, 2020.
- ↑ Chaston, Peter R. (1984). "A Long and Hot Summer". Weatherwise. 37: 18. doi:10.1080/00431672.1984.9933224.
- ↑ Chaston, Peter R. (1984). "Long Hot Summer". Weatherwise. Tandfonline. 37: 18. doi:10.1080/00431672.1984.9933224.