Ambient air quality criteria

Last updated

Ambient air quality criteria, or standards, are concentrations of pollutants in the air, and typically refer to outdoor air. The criteria are specified for a variety of reasons including for the protection of human health, buildings, crops, vegetation, ecosystems, as well as for planning and other purposes. There is no internationally accepted definition but usually "standards" have some legal or enforcement aspect, whereas "guidelines" may not be backed by laws. "Criteria/criterion" can be used as a generic term to cover standards and guidelines.

Contents

Various organisations have proposed criteria e.g. WHO, EU, US EPA. These criteria are often similar - but not always, even if they are proposed for the same purpose (e.g. the protection of human health).

Specifying the criteria

It is important for any numerical standard that averaging period, unit, and statistical measure are given (e.g. the 98th percentile of hourly means measured over a calendar year in micrograms per cubic metre (μg/m3)). Without these there is no common ground for a given criterion, making it confusing or even meaningless. Criteria can be set in different units (e.g. μg/m3, parts per billion by volume (ppbv), parts per billion by mass (ppb (mass)), parts per million (ppm)) and it is possible to convert between all of these units if the molecular mass of the pollutant and the temperature are known. Different standard temperatures are used throughout the world and so it is important to state the temperature of conversion (if relevant). Most pollutants have ambient criteria in the parts per billion (ppb) or μg/m3 range. Some have smaller units (e.g. dioxins are often in pico grams /m3); others have larger units (e.g. carbon monoxide (CO) in mg/m3). Particle pollution (e.g. PM10, PM1.0) is specified in units of mass (e.g. μg/m3) and not in units of volume (ppmv).

In the EU, the pollutants and their criteria are specified in Directive 2008/50/EC.

The criteria

Below is a list of available air quality criteria around the world. There is a lot of cross referencing between organizations (e.g. the International Finance Corp (IFC)) that have their own criteria but ultimately, many criteria are based on those specified by the World Health Organization (WHO). It is important when complying with ambient air quality criteria to check the direct reference as well. Not all related caveats/controlling parameters of a criterion can be put in the table, and therefore those specified below are mostly those that six criteria air pollutants most monitoring agencies specify. These agencies also list whether criteria must be monitored in a specific way to fit with compliance measures.

PollutantAbbr.ValueUnitsAveraging PeriodStatistical Measure# exceedencesOrganisationStatusApplicabilityNotes
Nitrogen dioxide NO240μg/m3Annual1MeanNoneWHO [1] GuidelineGlobal
Nitrogen dioxideNO2200μg/m31 hourMeanNoneWHO [1] GuidelineGlobal
Nitrogen dioxideNO240μg/m3AnnualMeanNoneEU [2] Limit ValueEU Member StatesCalendar Year
Nitrogen dioxideNO253ppbAnnualMeanNoneUS EPA [3] LegalUnited StatesPrimary and Secondary
Nitrogen dioxideNO2100μg/m3AnnualYrly mean of dailyNoneSCENR [4] LegalQatarCalendar Year
Nitrogen dioxideNO240μg/m3AnnualMeanNoneChinese Ministry of Ecology and Environment [5] LegalChina
Nitrogen dioxideNO2100μg/m3DailyMeanNew Zealand Ministry for the Environment [6] GuidelineNew ZealandCalendar Year
Nitrogen dioxideNO2113μg/m3DailyDaily mean of hourlyNoneJapanese Ministry of Environment [7] LegalJapanQuoted as 0.06 ppm
Nitrogen dioxideNO2150μg/m3Daily99.7%ile1 day/yrSCENR [4] LegalQatarCalendar Year
Nitrogen dioxideNO280μg/m3DailyMeanNoneChinese Ministry of Ecology and Environment [5] LegalChina
Nitrogen dioxideNO2100ppb1 hour98% of 1-hour daily maximum concentrations, averaged over 3 yearsNoneUS EPA [3] LegalUnited StatesPrimary
Nitrogen dioxideNO240μg/m3AnnualMeanNoneIndia Central Pollution Control Board (CPCB) [8] LegalIndiaCalendar Year
Nitrogen dioxideNO230μg/m3AnnualMeanNoneIndia Central Pollution Control Board(CPCB) [8] LegalIndia - Ecologically sensitive areasCalendar Year
Nitrogen dioxideNO280μg/m324 hour2MeanNoneIndia Central Pollution Control Board (CPCB) [8] LegalIndiaCalendar Year
Nitrogen dioxideNO2200μg/m31 hour99.79%ile18 hrs/yrEU [2] Limit valueEU Member StatesCalendar Year
Nitrogen dioxideNO2200μg/m31 hourMean9/yrNew Zealand Ministry for the Environment [9] LegalNew ZealandCalendar Year
Nitrogen dioxideNO2400μg/m31 hour99.7%ile26 hrs/yrSCENR [4] LegalQatarCalendar Year
Nitrogen dioxideNO2200μg/m31 hourMeanNoneChinese Ministry of Ecology and Environment [5] LegalChina
PollutantAbbr.ValueUnitsAveraging PeriodStatistical Measure# exceedencesOrganisationStatusApplicabilityNotes
Sulphur dioxide SO275ppb1 hour99% of 1-hour daily maximum concentrations, averaged over 3 yearsNoneUS EPA [3] LegalUnited States*Primary
Sulphur dioxideSO2500ppb3 hoursMeanOnce per yearUS EPA [3] LegalUnited StatesSecondary quoted as 0.5 ppm
Sulphur dioxideSO220μg/m3AnnualMeanNoneChinese Ministry of Ecology and Environment [5] LegalChina Category 1 Areas
Sulphur dioxideSO260μg/m3AnnualMeanNoneChinese Ministry of Ecology and Environment [5] LegalChina Category 2 Areas
Sulphur dioxideSO250μg/m3DailyMeanNoneChinese Ministry of Ecology and Environment [5] LegalChina Category 1 Areas
Sulphur dioxideSO220μg/m3AnnualMeanNoneIndia Central Pollution Control Board (CPCB) [8] LegalIndia - Ecologically sensitive areas
Sulphur dioxideSO250μg/m3AnnualMeanNoneIndia Central Pollution Control Board (CPCB) [8] LegalIndia
Sulphur dioxideSO280μg/m324 hourMeanNoneIndia Central Pollution Control Board (CPCB) [8] LegalIndia
Sulphur dioxideSO2150μg/m3DailyMeanNoneChinese Ministry of Ecology and Environment [5] LegalChina Category 2 Areas
Sulphur dioxideSO2150μg/m31 hourMeanNoneChinese Ministry of Ecology and Environment [5] LegalChina Category 1 Areas
Sulphur dioxideSO2500μg/m31 hourMeanNoneChinese Ministry of Ecology and Environment [5] LegalChina Category 2 Areas
Sulphur dioxideSO2125μg/m324 hourAny 24 hour periodNoneWHO [1] Interim Target (IT) 1GlobalWas the guideline in 2000
Sulphur dioxideSO250μg/m324 hourAny 24 hour periodNoneWHO [1] Interim Target (IT) 2GlobalCalendar Year (1 Jan - 31 Dec)
Sulphur dioxideSO2125μg/m324 hourAny 24 hour meanNoneWHO [1] Interim Target (IT) 1Global
Sulphur dioxideSO250μg/m324 hourAny 24 hour meanNoneWHO [1] Interim Target (IT) 2Global
Sulphur dioxideSO220μg/m324 hourAny 24 hour meanNoneWHO [1] GuidelineGlobal
Sulphur dioxideSO2500μg/m310 minuteAny 10 minute meanNoneWHO [1] GuidelineGlobal
Sulphur dioxideSO21300μg/m31 hour99.99%ile1 hr/yearRas LaffanLegalQatarCalendar Year
Sulphur dioxideSO2350μg/m31 hourMean9/yrNew Zealand Ministry for the Environment [6] LegalNew Zealand
Sulphur dioxideSO2570μg/m31 hourMeanNoneNew Zealand Ministry for the Environment [6] LegalNew Zealand
Sulphur dioxideSO2120μg/m324 hourAverageNew Zealand Ministry for the Environment [6] GuidelineNew Zealand
Abbr.ValueUnitsAveraging PeriodStatistical Measure# exceedencesOrganisationStatusApplicabilityNotes
PM10 "Coarse Particulate Matter" 150μg/m324 hourAverage over 3 yearsOnce per yearUS EPA [3] LegalUnited StatesPrimary and Secondary
PM10125μg/m324 hour99th %ile3 days/yrWHO [1] GuidelineGlobal
PM1050μg/m324 hourMeanNoneWHO [1] GuidelineGlobal
PM1020μg/m3AnnualMeanNoneWHO [1] GuidelineGlobal
PM1060μg/m3AnnualMeanNoneIndia Central Pollution Control Board (CPCB) [8] LegalIndia
PM1010μg/m324 hourMeanNoneIndia Central Pollution Control Board (CPCB) [8] LegalIndia
PM1050μg/m324 hourMean1/yrNew Zealand Ministry for the Environment [6] LegalNew Zealand
PM1040μg/m3AnnualMeanNoneChinese Ministry of Ecology and Environment [5] LegalChina Category 1 Areas
PM1070μg/m3AnnualMeanNoneChinese Ministry of Ecology and Environment [5] LegalChina Category 2 Areas
PM1050μg/m324 hourMeanNoneChinese Ministry of Ecology and Environment [5] LegalChina Category 1 Areas
PM10150μg/m324 hourMeanNoneChinese Ministry of Ecology and Environment [5] LegalChina Category 2 Areas
PM2.5 "Fine Particulate Matter" 35μg/m324 hour98% averaged over 3 yearsNoneUS EPA [3] LegalUnited StatesPrimary and Secondary
PM2.525μg/m324 hourAny 24 hr meanNoneWHO [1] GuidelineGlobal
PM2.560μg/m324 hourmeanNoneIndia Central Pollution Control Board (CPCB) [8] LegalIndia
PM2.540μg/m3AnnualMeanNoneIndia Central Pollution Control Board (CPCB) [8] LegalGlobal
PM2.575μg/m324 hourAny 24 hr meanNoneWHO [1] Interim target (IT) 1Global
PM2.550μg/m324 hourAny 24 hr meanNoneWHO [1] Interim target (IT) 2Global
PM2.537.5μg/m324 hourAny 24 hr meanNoneWHO [1] Interim target (IT) 3Global
PM2.512.0μg/m3AnnualAnnual mean over 3 yearsNoneUS EPA [3] LegalUnited StatesPrimary
PM2.515μg/m3AnnualMeanNoneChinese Ministry of Ecology and Environment [5] LegalChina Category 1 Areas
PM2.535μg/m3AnnualMeanNoneChinese Ministry of Ecology and Environment [5] LegalChina Category 2 Areas
PM2.515.0μg/m3AnnualAnnual mean over 3 yearsNoneUS EPA [3] LegalUnited StatesSecondary
PM2.510μg/m3AnnualMeanNoneWHO [1] GuidelineGlobal
PM2.525μg/m324 hourMeanNoneWHO [1] GuidelineGlobal
PM2.525μg/m3AnnualMeanNoneWHO [1] Interim target (IT) 2Global
PM2.515μg/m3AnnualMeanNoneWHO [1] Interim target (IT) 3Global
PM2.535μg/m324 hourMeanNoneChinese Ministry of Ecology and Environment [5] LegalChina Category 1 Areas
PM2.575μg/m324 hourMeanNoneChinese Ministry of Ecology and Environment [5] LegalChina Category 2 Areas
PollutantAbbr.ValueUnitsAveraging PeriodStatistical Measure# exceedencesOrganisationStatusApplicabilityNotes
Ozone O30.07ppm8 hoursAnnual 4th highest daily maximum 8-hour concentration, averaged over 3 years3/yrUS EPA [3] LegalUnited States*Primary and Secondary
OzoneO3100μg/m38 hoursAny 8 hour meanNoneWHO [1] GuidelineGlobal
OzoneO3100μg/m38 hoursMeanNoneIndia Central Pollution Control Board (CPCB) [8] GuidelineIndia
OzoneO3180μg/m31 hourMeanNoneIndia Central Pollution Control Board (CPCB) [8] LegalIndia
OzoneO3160μg/m38 hoursAny 8 hour meanNoneWHO [1] Interim targetGlobal
OzoneO3100μg/m38 hoursDaily maximum 8-hour averaged concentrationNoneChinese Ministry of Ecology and Environment [5] LegalChina Category 1 Areas
OzoneO3160μg/m38 hoursDaily maximum 8-hour averaged concentrationNoneChinese Ministry of Ecology and Environment [5] LegalChina Category 2 Areas
OzoneO3160μg/m31 hourMeanNoneChinese Ministry of Ecology and Environment [5] LegalChina Category 1 Areas
OzoneO3200μg/m31 hourMeanNoneChinese Ministry of Ecology and Environment [5] LegalChina Category 2 Areas
OzoneO3235μg/m31 hour99.9%8 hrs/yrSCENR [4] LegalQatarCalendar Year
OzoneO3120μg/m38 hours99.8%2x8hrs/yrSCENR [4] LegalQatarCalendar Year
OzoneO3150μg/m31 hourMeanNoneNew Zealand Ministry for the Environment [6] LegalNew Zealand
PollutantAbbr.ValueUnitsAveraging PeriodStatistical Measure# exceedencesOrganisationStatusApplicabilityNotes
Carbon monoxide CO35ppm1 hourMean1/yrUS EPA [3] LegalUnited StatesPrimary
Carbon monoxideCO40mg/m31 hourMaximumNoneSCENR [4] LegalQatarCalendar Year
Carbon monoxideCO4mg/m31 hourMaximumNoneIndia Central Pollution Control Board (CPCB) [8] LegalIndia
Carbon monoxideCO2mg/m38 hourMaximumNoneIndia Central Pollution Control Board (CPCB) [8] LegalIndia
Carbon monoxideCO10mg/m31 hourMeanNoneChinese Ministry of Ecology and Environment [5] LegalChina
Carbon monoxideCO9ppm8 hourMean1/yrUS EPA [3] LegalUnited StatesPrimary
Carbon monoxideCO10mg/m38 hourMaximumNoneSCENR [4] LegalQatarCalendar Year
Carbon monoxideCO10mg/m38 hourMean1/yrNew Zealand Ministry for the Environment [6] LegalNew Zealand
Carbon monoxideCO30mg/m31 hourMean1/yrNew Zealand Ministry for the Environment [6] LegalNew Zealand
Carbon monoxideCO4mg/m324 hourMeanNoneChinese Ministry of Ecology and Environment [5] LegalChina
PollutantAbbr.ValueUnitsAveraging PeriodStatistical Measure# exceedencesOrganisationStatusApplicabilityNotes
Lead Pb0.15μg/m33 monthRolling 3 month averageNoneUS EPA [3] LegalUnited StatesPrimary and Secondary
LeadPb0.5μg/m3AnnualMeanNoneChinese Ministry of Ecology and Environment [5] LegalChina
LeadPb0.5μg/m3AnnualMeanNoneIndia Central Pollution Control Board (CPCB) [8] LegalIndia
LeadPb1μg/m324 hoursMeanNoneIndia Central Pollution Control Board (CPCB) [8] LegalIndia
LeadPb1μg/m3SeasonMeanNoneChinese Ministry of Ecology and Environment [5] LegalChina

Footnotes

[1] Annual arithmetic mean of a minimum of 104 measurements in a year at a particular site, such as taken twice weekly as uniform 24-hour samples.

[2] 24/8/1 hourly monitored values, as applicable, shall be complied with 98% of the time, they may exceed the limits but not on two consecutive days of monitoring.

See also

Related Research Articles

Pollutant substance or energy source damaging to the environment

A pollutant is a substance or energy introduced into the environment that has undesired effects, or adversely affects the usefulness of a resource. A pollutant may cause long- or short-term damage by changing the growth rate of plant or animal species, or by interfering with human amenities, comfort, health, or property values. Some pollutants are biodegradable and therefore will not persist in the environment in the long term. However, the degradation products of some pollutants are themselves polluting such as the products DDE and DDD produced from the degradation of DDT.

Parts-per notation set of pseudo units to describe small values of miscellaneous dimensionless quantities

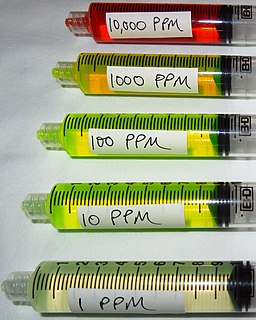
In science and engineering, the parts-per notation is a set of pseudo-units to describe small values of miscellaneous dimensionless quantities, e.g. mole fraction or mass fraction. Since these fractions are quantity-per-quantity measures, they are pure numbers with no associated units of measurement. Commonly used are ppm, ppb, ppt and ppq. This notation is not part of the SI system and its meaning is ambiguous.

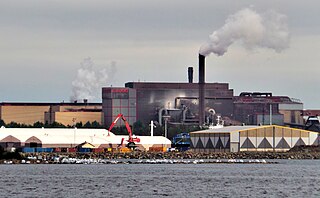
Industrial waste is the waste produced by industrial activity which includes any material that is rendered useless during a manufacturing process such as that of factories, industries, mills, and mining operations. Types of industrial waste include dirt and gravel, masonry and concrete, scrap metal, oil, solvents, chemicals, scrap lumber, even vegetable matter from restaurants. Industrial waste may be solid, liquid or gaseous. It may be hazardous or non-hazardous waste. Hazardous waste may be toxic, ignitable, corrosive, reactive, or radioactive. Industrial waste may pollute the air, the soil, or nearby water sources, eventually ending up in the sea. Industrial waste is often mixed into municipal waste, making accurate assessments difficult. An estimate for the US goes as high as 7.6 billion tons of industrial waste produced every year. Most countries have enacted legislation to deal with the problem of industrial waste, but strictness and compliance regimes vary. Enforcement is always an issue.

Nitrogen dioxide chemical compound

Nitrogen dioxide is the chemical compound with the formula NO
2
. It is one of several nitrogen oxides. NO
2
is an intermediate in the industrial synthesis of nitric acid, millions of tons of which are produced each year which is used primarily in the production of fertilizers. At higher temperatures it is a reddish-brown gas that has a characteristic sharp, biting odor and is a prominent air pollutant. Nitrogen dioxide is a paramagnetic, bent molecule with C2v point group symmetry.

Environmental chemistry The scientific study of the chemical and phenomena that occur in natural places

Environmental chemistry is the scientific study of the chemical and biochemical phenomena that occur in natural places. It should not be confused with green chemistry, which seeks to reduce potential pollution at its source. It can be defined as the study of the sources, reactions, transport, effects, and fates of chemical species in the air, soil, and water environments; and the effect of human activity and biological activity on these. Environmental chemistry is an interdisciplinary science that includes atmospheric, aquatic and soil chemistry, as well as heavily relying on analytical chemistry and being related to environmental and other areas of science.

National Ambient Air Quality Standards

The U.S. National Ambient Air Quality Standards are standards for harmful pollutants. Established by the United States Environmental Protection Agency (EPA) under authority of the Clean Air Act, NAAQS is applied for outdoor air throughout the country.

Air quality index measure of pollution

An air quality index (AQI) is used by government agencies to communicate to the public how polluted the air currently is or how polluted it is forecast to become. Public health risks increase as the AQI rises. Different countries have their own air quality indices, corresponding to different national air quality standards. Some of these are the Air Quality Health Index (Canada), the Air Pollution Index (Malaysia), and the Pollutant Standards Index (Singapore).

Various governmental agencies involved with environmental protection and with occupational safety and health have promulgated regulations limiting the allowable concentrations of gaseous pollutants in the ambient air or in emissions to the ambient air. Such regulations involve a number of different expressions of concentration. Some express the concentrations as ppmv and some express the concentrations as mg/m3, while others require adjusting or correcting the concentrations to reference conditions of moisture content, oxygen content or carbon dioxide content. This article presents a set of useful conversions and formulas for air dispersion modeling of atmospheric pollutants and for complying with the various regulations as to how to express the concentrations obtained by such modeling.

Exposure assessment is a branch of environmental science and occupational hygiene that focuses on the processes that take place at the interface between the environment containing the contaminant(s) of interest and the organism(s) being considered. These are the final steps in the path to release an environmental contaminant, through transport to its effect in a biological system. It tries to measure how much of a contaminant can be absorbed by an exposed target organism, in what form, at what rate and how much of the absorbed amount is actually available to produce a biological effect. Although the same general concepts apply to other organisms, the overwhelming majority of applications of exposure assessment are concerned with human health, making it an important tool in public health.

The Air Pollution Index (API) is a simple and generalized way to describe the air quality, which is used in Malaysia. It is calculated from several sets of air pollution data. It was formerly used in mainland China and Hong Kong. In mainland China the API was replaced by an updated air quality index in early 2012 and on 30 December 2013 Hong Kong moved to a health based index.

Criteria air Pollutants (CAP), or criteria pollutants, are a set of air pollutants that cause smog, acid rain, and other health hazards. CAPs are typically emitted from many sources in industry, mining, transportation, electricity generation and agriculture. In many cases they are the products of the combustion of fossil fuels or industrial processes.

Air pollution Introduction of particulates, biological molecules, or other harmful materials into the Earths atmosphere

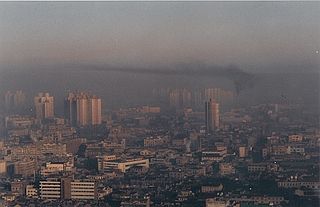
Air pollution occurs when harmful or excessive quantities of substances including gases, particulates, and biological molecules are introduced into Earth's atmosphere. It may cause diseases, allergies and even death to humans; it may also cause harm to other living organisms such as animals and food crops, and may damage the natural or built environment. Both human activity and natural processes can generate air pollution.

Ozoneweb

Ozoneweb is an EEA website on near real-time ozone. The website allows the general public to track air quality in a specific region and on a European level. The website displays ozone levels via a map of Europe. Background information on ozone and its health impacts are also provided. Users can monitor ozone levels in a neighbouring country or a holiday destination, check recent trends and track the spread of ozone across Europe. The website now includes a module to display exceedances in countries.

Title 40 is a part of the United States Code of Federal Regulations. Title 40 arranges mainly environmental regulations that were promulgated by the US Environmental Protection Agency (EPA), based on the provisions of United States laws. Parts of the regulation may be updated annually on July 1.

Particulate pollution is pollution of an environment that consists of particles suspended in some medium. There are three primary forms: atmospheric particulate matter, marine debris, and space debris. Some particles are released directly from a specific source, while others form in chemical reactions in the atmosphere. Particulate pollution can be derived from either natural sources or anthropogenic processes.

Clean Air Act (United States) United States federal law designed to control air pollution on a national level

The Clean Air Act of 1963 is a United States federal law designed to control air pollution on a national level. It is one of the United States' first and most influential modern environmental laws, and one of the most comprehensive air quality laws in the world. As with many other major U.S. federal environmental statutes, it is administered by the U.S. Environmental Protection Agency (EPA), in coordination with state, local, and tribal governments. Its implementing regulations are codified at 40 C.F.R. Sub-chapter C, Parts 50-97.

Air pollutant concentrations

Air pollutant concentrations, as measured or as calculated by air pollution dispersion modeling, must often be converted or corrected to be expressed as required by the regulations issued by various governmental agencies. Regulations that define and limit the concentration of pollutants in the ambient air or in gaseous emissions to the ambient air are issued by various national and state environmental protection and occupational health and safety agencies.

Drinking water quality standards describes the quality parameters set for drinking water. Despite the truth that every human on this planet needs drinking water to survive and that water may contain many harmful constituents, there are no universally recognized and accepted international standards for drinking water. Even where standards do exist, and are applied, the permitted concentration of individual constituents may vary by as much as ten times from one set of standards to another.

Water quality law

Water quality laws govern the release of pollutants into water resources, including surface water, ground water, and stored drinking water. Some water quality laws, such as drinking water regulations, may be designed solely with reference to human health. Many others, including restrictions on the alteration of the chemical, physical, radiological, and biological characteristics of water resources, may also reflect efforts to protect aquatic ecosystems more broadly. Regulatory efforts may include identifying and categorizing water pollutants, dictating acceptable pollutant concentrations in water resources, and limiting pollutant discharges from effluent sources. Regulatory areas include sewage treatment and disposal, industrial and agricultural waste water management, and control of surface runoff from construction sites and urban environments.

Since the late 1970s, the European Union's (EU) policy has been to develop and drive appropriate measures to improve air quality throughout the EU. The control of emissions from mobile sources, improving fuel quality and promoting and integrating environmental protection requirements into the transport and energy sector are part of these aims.

References

  1. 1 2 3 4 5 6 7 8 9 10 11 12 13 14 15 16 17 18 19 20 21 Air quality guidelines - global update 2005 www.who.int/phe/health_topics/outdoorair/outdoorair_aqg/en/
  2. 1 2 DIRECTIVE 2008/50/EC OF THE EUROPEAN PARLIAMENT AND OF THE COUNCIL of 21 May 2008 on ambient air quality and cleaner air for Europe http://eur-lex.europa.eu/legal-content/EN/TXT/?uri=CELEX:32008L0050
  3. 1 2 3 4 5 6 7 8 9 10 11 12 EPA, OAR, US. "NAAQS Table | US EPA". US EPA. Retrieved 2018-11-05.
  4. 1 2 3 4 5 6 7 Supreme Council for Environment and Natural Resources, Executive Bye-law for the Environment Protection Law Issued via the Decree Law No. 30 for the Year 2002, Annex 3"
  5. 1 2 3 4 5 6 7 8 9 10 11 12 13 14 15 16 17 18 19 20 21 22 23 24 25 "GB 3095-2012" (PDF).
  6. 1 2 3 4 5 6 7 8 "Nitrogen dioxide | Ministry for the Environment". www.mfe.govt.nz. Retrieved 2017-04-05.
  7. Japanese Ministry of Environment, Environmental Quality Standards - Air Quality https://www.env.go.jp/en/air/aq/aq.html
  8. 1 2 3 4 5 6 7 8 9 10 11 12 13 14 15 16 India Central Pollution Control Board - Air Quality Standards http://cpcb.nic.in/air-quality-standard/
  9. "Resource Management (National Environmental Standards for Air Quality) Regulations 2004 (SR 2004/309) (as at 17 October 2014) – New Zealand Legislation". www.legislation.govt.nz. Retrieved 2017-04-05.