This article relies largely or entirely on a single source .(September 2019) |
This article relies largely or entirely on a single source .(September 2019) |
| State or territory (2017) | White | Black or African American | Latino | American Indian and Alaska Native | Asian | Native Hawaiian and Other Pacific Islander | Total |
|---|---|---|---|---|---|---|---|
| United States | 1,992,461 | 560,715 | 898,764 | 29,957 | 249,250 | 9,426 | 3,740,573 |
| Alabama | 34,377 | 17,963 | 4,546 | 131 | 950 | 44 | 58,941 |
| Alaska | 5,259 | 329 | 799 | 1,903 | 686 | 308 | 10,445 |
| Arizona | 33,694 | 4,241 | 34,377 | 4,256 | 2,987 | 217 | 81,872 |
| Arkansas | 24,089 | 7,082 | 4,048 | 239 | 783 | 470 | 37,520 |
| California | 127,822 | 23,441 | 220,122 | 1,411 | 72,049 | 1,809 | 471,658 |
| Colorado | 37,516 | 3,110 | 18,125 | 421 | 2,611 | 145 | 64,382 |
| Connecticut | 18,842 | 4,301 | 8,833 | 28 | 2,475 | 7 | 35,221 |
| Delaware | 5,309 | 2,818 | 1,748 | 20 | 646 | 3 | 10,855 |
| District of Columbia | 3,042 | 4,573 | 1,336 | 9 | 396 | 2 | 9,560 |
| Florida | 96,280 | 49,428 | 67,049 | 270 | 7,015 | 159 | 223,630 |
| Georgia | 56,985 | 44,447 | 17,954 | 113 | 6,039 | 110 | 129,243 |
| Hawaii | 3,407 | 406 | 2,672 | 39 | 4,653 | 1,684 | 17,517 |
| Idaho | 17,151 | 243 | 3,598 | 289 | 366 | 48 | 22,181 |
| Illinois | 78,925 | 25,685 | 31,428 | 90 | 9,650 | 43 | 149,390 |
| Indiana | 60,515 | 9,971 | 7,669 | 70 | 2,535 | 54 | 82,170 |
| Iowa | 30,010 | 2,657 | 3,527 | 183 | 1,321 | 128 | 38,430 |
| Kansas | 25,594 | 2,548 | 5,963 | 171 | 1,255 | 77 | 36,519 |
| Kentucky | 44,280 | 5,006 | 3,162 | 49 | 1,173 | 68 | 54,752 |
| Louisiana | 31,509 | 22,469 | 4,778 | 295 | 1,169 | 23 | 61,018 |
| Maine | 10,958 | 545 | 229 | 85 | 219 | 3 | 12,298 |
| Maryland | 29,809 | 22,327 | 12,223 | 87 | 5,276 | 40 | 71,641 |
| Massachusetts | 40,773 | 6,953 | 13,609 | 63 | 6,067 | 23 | 70,702 |
| Michigan | 75,578 | 20,849 | 7,339 | 396 | 4,468 | 30 | 111,426 |
| Minnesota | 47,088 | 8,163 | 5,023 | 1,042 | 5,323 | 56 | 68,595 |
| Mississippi | 18,620 | 16,087 | 1,650 | 213 | 502 | 12 | 37,357 |
| Missouri | 53,800 | 10,495 | 4,156 | 167 | 1,773 | 183 | 73,034 |
| Montana | 9,372 | 64 | 585 | 1,231 | 121 | 18 | 11,799 |
| Nebraska | 17,827 | 1,688 | 4,382 | 372 | 861 | 27 | 25,821 |
| Nevada | 13,171 | 4,471 | 13,176 | 305 | 2,685 | 322 | 35,756 |
| New Hampshire | 10,524 | 234 | 673 | 21 | 479 | 5 | 12,116 |
| New Jersey | 45,825 | 13,684 | 27,354 | 46 | 11,691 | 26 | 101,250 |
| New Mexico | 6,522 | 387 | 13,362 | 2,677 | 420 | 17 | 23,767 |
| New York | 111,690 | 34,062 | 53,112 | 331 | 25,429 | 51 | 229,737 |
| North Carolina | 64,278 | 27,886 | 18,464 | 1,466 | 5,006 | 131 | 120,125 |
| North Dakota | 7,931 | 608 | 587 | 817 | 286 | 10 | 10,737 |
| Ohio | 98,762 | 22,431 | 7,468 | 116 | 4,380 | 61 | 136,832 |
| Oklahoma | 28,976 | 4,085 | 7,441 | 4,614 | 1,328 | 232 | 50,214 |
| Oregon | 29,232 | 994 | 8,275 | 429 | 2,376 | 300 | 43,631 |
| Pennsylvania | 92,297 | 18,400 | 15,840 | 92 | 6,401 | 43 | 137,745 |
| Rhode Island | 6,142 | 776 | 2,760 | 44 | 542 | 7 | 10,638 |
| South Carolina | 32,283 | 16,851 | 5,221 | 138 | 1,125 | 45 | 57,029 |
| South Dakota | 8,620 | 398 | 624 | 1,807 | 248 | 9 | 12,134 |
| Tennessee | 53,721 | 16,050 | 7,684 | 90 | 1,905 | 60 | 81,016 |
| Texas | 127,533 | 48,242 | 180,216 | 664 | 20,385 | 510 | 382,050 |
| Utah | 36,492 | 569 | 7,832 | 445 | 1,233 | 469 | 48,585 |
| Vermont | 5,134 | 115 | 123 | 14 | 159 | 2 | 5,655 |
| Virginia | 55,540 | 21,101 | 13,999 | 155 | 7,670 | 125 | 100,391 |
| Washington | 50,679 | 3,944 | 15,973 | 1,112 | 8,836 | 1,164 | 87,562 |
| West Virginia | 16,943 | 629 | 390 | 15 | 201 | 11 | 18,675 |
| Wisconsin | 46,309 | 6,864 | 6,368 | 715 | 3,017 | 30 | 64,975 |
| Wyoming | 5,426 | 45 | 892 | 201 | 79 | 5 | 6,903 |
| Guam | 193 | 31 | 27 | 8 | 796 | 2,102 | 3,297 |
| Northern Mariana Islands | 2 | 1 | 0 | 0 | 53 | 289 | 363 |
| Puerto Rico | 596 | 65 | 23,582 | 0 | 25 | 1 | 24,310 |
| State or territory (2017) | White | Black or African American | Latino | American Indian and Alaska Native | Asian | Native Hawaiian and Other Pacific Islander | Total |
|---|---|---|---|---|---|---|---|
| United States | 52% | 14% | 23% | 1% | 7% | 0% | 100% |
| Alabama | 58% | 31% | 8% | 0% | 2% | 0% | 100% |
| Alaska | 50% | 3% | 8% | 18% | 7% | 3% | 100% |
| Arizona | 41% | 5% | 42% | 5% | 4% | 0% | 100% |
| Arkansas | 64% | 19% | 11% | 1% | 2% | 1% | 100% |
| California | 27% | 5% | 47% | 0% | 15% | 0% | 100% |
| Colorado | 58% | 5% | 28% | 1% | 4% | 0% | 100% |
| Connecticut | 54% | 12% | 25% | 0% | 7% | 0% | 100% |
| Delaware | 49% | 26% | 16% | 0% | 6% | 0% | 100% |
| District of Columbia | 32% | 48% | 14% | 0% | 4% | 0% | 100% |
| Florida | 43% | 22% | 30% | 0% | 3% | 0% | 100% |
| Georgia | 44% | 34% | 14% | 0% | 5% | 0% | 100% |
| Hawaii | 19% | 2% | 15% | 0% | 27% | 10% | 100% |
| Idaho | 77% | 1% | 16% | 1% | 2% | 0% | 100% |
| Illinois | 53% | 17% | 21% | 0% | 7% | 0% | 100% |
| Indiana | 74% | 12% | 9% | 0% | 3% | 0% | 100% |
| Iowa | 78% | 7% | 9% | 1% | 3% | 0% | 100% |
| Kansas | 70% | 7% | 16% | 1% | 3% | 0% | 100% |
| Kentucky | 81% | 9% | 6% | 0% | 2% | 0% | 100% |
| Louisiana | 52% | 37% | 8% | 1% | 2% | 0% | 100% |
| Maine | 89% | 4% | 2% | 1% | 2% | 0% | 100% |
| Maryland | 42% | 31% | 17% | 0% | 7% | 0% | 100% |
| Massachusetts | 58% | 10% | 19% | 0% | 9% | 0% | 100% |
| Michigan | 68% | 19% | 7% | 0% | 4% | 0% | 100% |
| Minnesota | 69% | 12% | 7% | 2% | 8% | 0% | 100% |
| Mississippi | 50% | 43% | 4% | 1% | 1% | 0% | 100% |
| Missouri | 74% | 14% | 6% | 0% | 2% | 0% | 100% |
| Montana | 79% | 1% | 5% | 10% | 1% | 0% | 100% |
| Nebraska | 69% | 7% | 17% | 1% | 3% | 0% | 100% |
| Nevada | 37% | 13% | 37% | 1% | 8% | 1% | 100% |
| New Hampshire | 87% | 2% | 6% | 0% | 4% | 0% | 100% |
| New Jersey | 45% | 14% | 27% | 0% | 12% | 0% | 100% |
| New Mexico | 27% | 2% | 56% | 11% | 2% | 0% | 100% |
| New York | 49% | 15% | 23% | 0% | 11% | 0% | 100% |
| North Carolina | 54% | 23% | 15% | 1% | 4% | 0% | 100% |
| North Dakota | 74% | 6% | 6% | 8% | 3% | 0% | 100% |
| Ohio | 72% | 16% | 6% | 0% | 3% | 0% | 100% |
| Oklahoma | 58% | 8% | 15% | 9% | 3% | 1% | 100% |
| Oregon | 67% | 2% | 19% | 1% | 5% | 1% | 100% |
| Pennsylvania | 67% | 13% | 12% | 0% | 5% | 0% | 100% |
| Rhode Island | 58% | 7% | 26% | 0% | 5% | 0% | 100% |
| South Carolina | 57% | 30% | 9% | 0% | 2% | 0% | 100% |
| South Dakota | 71% | 3% | 5% | 15% | 2% | 0% | 100% |
| Tennessee | 66% | 20% | 10% | 0% | 2% | 0% | 100% |
| Texas | 33% | 13% | 47% | 0% | 5% | 0% | 100% |
| Utah | 75% | 1% | 16% | 1% | 3% | 1% | 100% |
| Vermont | 91% | 2% | 2% | 0% | 3% | 0% | 100% |
| Virginia | 55% | 21% | 14% | 0% | 8% | 0% | 100% |
| Washington | 58% | 5% | 18% | 1% | 10% | 1% | 100% |
| West Virginia | 91% | 3% | 2% | 0% | 1% | 0% | 100% |
| Wisconsin | 71% | 11% | 10% | 1% | 5% | 0% | 100% |
| Wyoming | 79% | 1% | 13% | 3% | 1% | 0% | 100% |
| Guam | 6% | 1% | 1% | 0% | 24% | 64% | 100% |
| Northern Mariana Islands | 1% | 0% | N/A | N/A | 15% | 80% | 100% |
| Puerto Rico | 3% | 0% | 97% | N/A | 0% | 0% | 100% |
Data are by place of residence. Data reflect race and Latino origin of the infant's mother. Race and Latino origin are reported separately on birth certificates; persons of Latino origin may be of any race. In this table, non-Latino women are classified by race. Race categories are consistent with the 1997 Office of Management and Budget standards. Single race is defined as only one race reported on the birth certificate.
The masculine term Latino, along with its feminine form Latina, is a noun and adjective, often used in English, Spanish, and Portuguese, that most commonly refers to United States inhabitants who have cultural ties to Latin America.

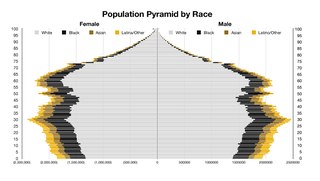
The United States had an official resident population of 331,893,745 on July 1, 2021, according to the U.S. Census Bureau. This figure includes the 50 states and the District of Columbia but excludes the population of five unincorporated U.S. territories as well as several minor island possessions. The United States is the third most populous country in the world. The Census Bureau showed a population increase of 0.12% for the twelve-month period ending in July 2021, below the world average annual rate of 0.9%. The total fertility rate in the United States estimated for 2021 is 1.664 children per woman, which is below the replacement fertility rate of approximately 2.1.

Mexican Americans are Americans of Mexican heritage. In 2019, Mexican Americans comprised 11.3% of the US population and 61.5% of all Latino Americans. In 2019, 71% of Mexican Americans were born in the United States, though they make up 53% of the total population of foreign-born Latino Americans and 25% of the total foreign-born population. The United States is home to the second-largest Mexican community in the world, second only to Mexico itself. Most Mexican Americans reside in the Southwest. Many Mexican Americans living in the United States have assimilated into American culture which has made some become less connected with their culture of birth and sometimes creates an identity crisis.
Race and ethnicity in the United States census, defined by the federal Office of Management and Budget (OMB) and the United States Census Bureau, are the self-identified categories of race or races and ethnicity chosen by residents, with which they most closely identify, and indicate whether they are of Hispanic or Latino origin.
The 2010 census estimated Alabama's population at 4,802,740, an increase of 332,636 or 7.5% since 2000. This includes a natural increase of 87,818 and a net migration of 73,178 people into the state. Immigration from outside the United States resulted in a net increase of 30,537 and migration within the country produced a net increase of 42,641.
White Americans are Americans who identify as and are perceived to be white people. This group constitutes the majority of the people in the United States. As of the 2020 Census, 61.6%, or 204,277,273 people, were white alone. This represented a national white demographic decline from a 72.4% share of the US's population in 2010.
The United States of America has a racially and ethnically diverse population. At the federal level, race and ethnicity have been categorized separately. The most recent United States Census officially recognized five racial categories as well as people of two or more races. The Census Bureau also classified respondents as "Hispanic or Latino" or "Not Hispanic or Latino", identifying Hispanic and Latino as an ethnicity, which comprises the largest minority group in the nation. The Census also asked an "Ancestry Question," which covers the broader notion of ethnicity, in the 2000 Census long form and the 2010 American Community Survey; the question worded differently on "origins" will return in the 2020 Census.
Texas is the second-most populous US state, with a 2020 US census resident population of 29,145,505, and apportioned population of 29,183,290. Since the beginning of the 21st century, the state of Texas has experienced strong population growth. Texas has many major cities and metropolitan areas, along with many towns and rural areas. Much of the population is concentrated in the major cities of Houston, San Antonio, Dallas, Fort Worth, Austin, and El Paso, and their corresponding metropolitan areas.

This article refers to the demographics of the U.S. state of Arkansas.
Tennessee is the sixteenth most populous state in the United States, and has the twentieth-highest population density. The 2020 United States census reported its population to be 6,916,897.
Asian Hispanic and Latino Americans are Americans of Asian ancestry that speak the Spanish or Portuguese language natively and/or are from Spain or Latin America, respectively. This includes Hispanic and Latino Americans who identify themselves as Asian Americans.
The demographics of Georgia are inclusive of the ninth most populous state in the United States, with over 9.68 million people, just over 3% of America's population.

Non-Hispanic whites or Non-Latino whites are Americans who identify as "white", and are not of Hispanic or Latino heritage. The United States Census Bureau defines white to include European Americans, Middle Eastern Americans, and North African Americans. Americans of European ancestry represent ethnic groups and more than half of the white population are German, Irish, Scottish, English, Italian, French and Polish Americans. In the United States, this population was first derived from English settlement of the America, as well as settlement by other Europeans such as the Germans and Dutch that began in the 17th century. Continued growth since the early 19th century is attributed to sustained very high birth rates alongside relatively low death rates among settlers and natives alike as well as periodically massive immigration from European countries, especially Germany, Ireland, England, Italy, Greece, the Netherlands, France and Wales, as well as Poland, Russia, and many more countries. It typically refers to an English-speaking American in distinction to Spanish speakers in Mexico and the Southwestern states. In some parts of the country, the term Anglo-American is used to refer to non-Hispanic white English speakers as distinct from Spanish and Portuguese speakers although the term is more frequently used to refer to people of British or English descent and might include white people of Hispanic descent who no longer speak Spanish.
Utah is the 30th most populous state in the United States with a population of about 3.3 million, according to projections from the US Census Bureau's 2017 estimates. The state has also been characterized by a tremendous amount of growth in the last decade, with the highest percent increase in population of any state since 2010. Utah has a surface area of 84,899 square miles, though around 80% of its population is concentrated around a metropolitan area in the north-central part of the state known as the Wasatch Front.
The Population Estimates Program (PEP) is a program of the US Census Bureau that publishes annual population estimates and estimates of birth, death, and international migration rates for people in the United States. In addition to publishing those aggregate estimates for the entire country, the program also publishes those yearly estimates by age, sex, race, and Hispanic origin at the national, state, county and city and town level. By doing so, the Population Estimates Program provides up-to-date information on how the size and distribution of the US population has changed each year since the most recent 10-year US Census.
The U.S. state of South Carolina is the 23rd largest state by population, with a population of 5,024,369 according to 2017 United States Census estimates.
The racial and ethnic demographics of the United States have changed dramatically throughout its history.
Hispanic and Latino Arizonians are residents of the state of Arizona who are of Hispanic or Latino ancestry. As of the 2010 U.S. Census, Hispanics and Latinos of any race were 30% of the state's population.