See also
| This disambiguation page lists articles associated with the title Correlation. If an internal link led you here, you may wish to change the link to point directly to the intended article. |
Correlation is a measure of relationship between two mathematical variables or measured data values, which includes the Pearson correlation coefficient as a special case.
Correlation may also refer to:
| This disambiguation page lists articles associated with the title Correlation. If an internal link led you here, you may wish to change the link to point directly to the intended article. |

In statistics, correlation or dependence is any statistical relationship, whether causal or not, between two random variables or bivariate data. In the broadest sense correlation is any statistical association, though it commonly refers to the degree to which a pair of variables are linearly related. Familiar examples of dependent phenomena include the correlation between the height of parents and their offspring, and the correlation between the price of a good and the quantity the consumers are willing to purchase, as it is depicted in the so-called demand curve.

In statistics, the Pearson correlation coefficient, also referred to as Pearson's r, the Pearson product-moment correlation coefficient (PPMCC), or the bivariate correlation, is a statistic that measures linear correlation between two variables X and Y. It has a value between +1 and −1. A value of +1 is total positive linear correlation, 0 is no linear correlation, and −1 is total negative linear correlation.

In statistics, Spearman's rank correlation coefficient or Spearman's ρ, named after Charles Spearman and often denoted by the Greek letter (rho) or as , is a nonparametric measure of rank correlation. It assesses how well the relationship between two variables can be described using a monotonic function.
Reliability in statistics and psychometrics is the overall consistency of a measure. A measure is said to have a high reliability if it produces similar results under consistent conditions. "It is the characteristic of a set of test scores that relates to the amount of random error from the measurement process that might be embedded in the scores. Scores that are highly reliable are precise, reproducible, and consistent from one testing occasion to another. That is, if the testing process were repeated with a group of test takers, essentially the same results would be obtained. Various kinds of reliability coefficients, with values ranging between 0.00 and 1.00, are usually used to indicate the amount of error in the scores." For example, measurements of people's height and weight are often extremely reliable.
In physics, two wave sources are perfectly coherent if their frequency and waveform are identical and their phase difference is constant. Coherence is an ideal property of waves that enables stationary interference. It contains several distinct concepts, which are limiting cases that never quite occur in reality but allow an understanding of the physics of waves, and has become a very important concept in quantum physics. More generally, coherence describes all properties of the correlation between physical quantities of a single wave, or between several waves or wave packets.

A time series is a series of data points indexed in time order. Most commonly, a time series is a sequence taken at successive equally spaced points in time. Thus it is a sequence of discrete-time data. Examples of time series are heights of ocean tides, counts of sunspots, and the daily closing value of the Dow Jones Industrial Average.

A scatter plot is a type of plot or mathematical diagram using Cartesian coordinates to display values for typically two variables for a set of data. If the points are coded (color/shape/size), one additional variable can be displayed. The data are displayed as a collection of points, each having the value of one variable determining the position on the horizontal axis and the value of the other variable determining the position on the vertical axis.
In statistics, an effect size is a quantitative measure of the magnitude of a phenomenon. It can refer to the value of a statistic calculated from a sample of data, the value of a parameter of a hypothetical statistical population, or to the equation that operationalizes how statistics or parameters lead to the effect size value. Examples of effect sizes include the correlation between two variables, the regression coefficient in a regression, the mean difference, or the risk of a particular event happening. Effect sizes complement statistical hypothesis testing, and play an important role in power analyses, sample size planning, and in meta-analyses. The cluster of data-analysis methods concerning effect sizes is referred to as estimation statistics.
In statistics and research, internal consistency is typically a measure based on the correlations between different items on the same test. It measures whether several items that propose to measure the same general construct produce similar scores. For example, if a respondent expressed agreement with the statements "I like to ride bicycles" and "I've enjoyed riding bicycles in the past", and disagreement with the statement "I hate bicycles", this would be indicative of good internal consistency of the test.
In statistics, a contingency table is a type of table in a matrix format that displays the (multivariate) frequency distribution of the variables. They are heavily used in survey research, business intelligence, engineering and scientific research. They provide a basic picture of the interrelation between two variables and can help find interactions between them. The term contingency table was first used by Karl Pearson in "On the Theory of Contingency and Its Relation to Association and Normal Correlation", part of the Drapers' Company Research Memoirs Biometric Series I published in 1904.
In chaos theory, the correlation dimension is a measure of the dimensionality of the space occupied by a set of random points, often referred to as a type of fractal dimension.

Lithostratigraphy is a sub-discipline of stratigraphy, the geological science associated with the study of strata or rock layers. Major focuses include geochronology, comparative geology, and petrology. In general a stratum will be primarily igneous or sedimentary relating to how the rock was formed.
In statistics, a rank correlation is any of several statistics that measure an ordinal association—the relationship between rankings of different ordinal variables or different rankings of the same variable, where a "ranking" is the assignment of the ordering labels "first", "second", "third", etc. to different observations of a particular variable. A rank correlation coefficient measures the degree of similarity between two rankings, and can be used to assess the significance of the relation between them. For example, two common nonparametric methods of significance that use rank correlation are the Mann–Whitney U test and the Wilcoxon signed-rank test.
Convergent validity, a parameter often used in sociology, psychology, and other behavioral sciences, refers to the degree to which two measures of constructs that theoretically should be related, are in fact related. Convergent validity, along with discriminant validity, is a subtype of construct validity. Convergent validity can be established if two similar constructs correspond with one another, while discriminant validity applies to two dissimilar constructs that are easily differentiated.
In statistics, the Kendall rank correlation coefficient, commonly referred to as Kendall's τ coefficient, is a statistic used to measure the ordinal association between two measured quantities. A τ test is a non-parametric hypothesis test for statistical dependence based on the τ coefficient.
In probability theory and statistics, partial correlation measures the degree of association between two random variables, with the effect of a set of controlling random variables removed. If we are interested in finding to what extent there is a numerical relationship between two variables of interest, using their correlation coefficient will give misleading results if there is another, confounding, variable that is numerically related to both variables of interest. This misleading information can be avoided by controlling for the confounding variable, which is done by computing the partial correlation coefficient. This is precisely the motivation for including other right-side variables in a multiple regression; but while multiple regression gives unbiased results for the effect size, it does not give a numerical value of a measure of the strength of the relationship between the two variables of interest.
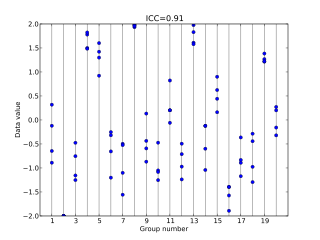
In statistics, the intraclass correlation, or the intraclass correlation coefficient (ICC), is a descriptive statistic that can be used when quantitative measurements are made on units that are organized into groups. It describes how strongly units in the same group resemble each other. While it is viewed as a type of correlation, unlike most other correlation measures it operates on data structured as groups, rather than data structured as paired observations.
John Frederick Norman Green was an English geologist who won the prestigious Lyell Medal in 1925 and served as President of the Geological Society of London between 1934 and 1936.
In physics, Bose–Einstein correlations are correlations between identical bosons. They have important applications in astronomy, optics, particle and nuclear physics.
A correlation coefficient is a numerical measure of some type of correlation, meaning a statistical relationship between two variables. The variables may be two columns of a given data set of observations, often called a sample, or two components of a multivariate random variable with a known distribution.