
In microeconomics, supply and demand is an economic model of price determination in a market. It postulates that, holding all else equal, in a competitive market, the unit price for a particular good, or other traded item such as labor or liquid financial assets, will vary until it settles at a point where the quantity demanded will equal the quantity supplied, resulting in an economic equilibrium for price and quantity transacted. The concept of supply and demand forms the theoretical basis of modern economics.

In economics, an indifference curve connects points on a graph representing different quantities of two goods, points between which a consumer is indifferent. That is, any combinations of two products indicated by the curve will provide the consumer with equal levels of utility, and the consumer has no preference for one combination or bundle of goods over a different combination on the same curve. One can also refer to each point on the indifference curve as rendering the same level of utility (satisfaction) for the consumer. In other words, an indifference curve is the locus of various points showing different combinations of two goods providing equal utility to the consumer. Utility is then a device to represent preferences rather than something from which preferences come. The main use of indifference curves is in the representation of potentially observable demand patterns for individual consumers over commodity bundles.
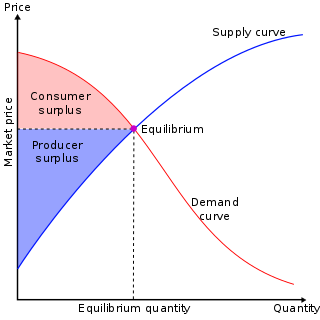
In mainstream economics, economic surplus, also known as total welfare or total social welfare or Marshallian surplus, is either of two related quantities:
Comparative advantage in an economic model is the advantage over others in producing a particular good. A good can be produced at a lower relative opportunity cost or autarky price, i.e. at a lower relative marginal cost prior to trade. Comparative advantage describes the economic reality of the work gains from trade for individuals, firms, or nations, which arise from differences in their factor endowments or technological progress.
In economics, elasticity measures the responsiveness of one economic variable to a change in another. If the price elasticity of the demand of something is -2, a 10% increase in price causes the quantity demanded to fall by 20%. Elasticity in economics provides an understanding of changes in the behavior of the buyers and sellers with price changes. There are two types of elasticity for demand and supply, one is inelastic demand and supply and other one is elastic demand and supply.
The theory of consumer choice is the branch of microeconomics that relates preferences to consumption expenditures and to consumer demand curves. It analyzes how consumers maximize the desirability of their consumption, by maximizing utility subject to a consumer budget constraint. Factors influencing consumers' evaluation of the utility of goods include: income level, cultural factors, product information and physio-psychological factors.

In microeconomics, a production–possibility frontier (PPF), production possibility curve (PPC), or production possibility boundary (PPB) is a graphical representation showing all the possible options of output for two goods that can be produced using all factors of production, where the given resources are fully and efficiently utilized per unit time. A PPF illustrates several economic concepts, such as allocative efficiency, economies of scale, opportunity cost, productive efficiency, and scarcity of resources.

In microeconomics, two goods are substitutes if the products could be used for the same purpose by the consumers. That is, a consumer perceives both goods as similar or comparable, so that having more of one good causes the consumer to desire less of the other good. Contrary to complementary goods and independent goods, substitute goods may replace each other in use due to changing economic conditions. An example of substitute goods is Coca-Cola and Pepsi; the interchangeable aspect of these goods is due to the similarity of the purpose they serve, i.e fulfilling customers' desire for a soft drink. These types of substitutes can be referred to as close substitutes.

In economics, a complementary good is a good whose appeal increases with the popularity of its complement. Technically, it displays a negative cross elasticity of demand and that demand for it increases when the price of another good decreases. If is a complement to , an increase in the price of will result in a negative movement along the demand curve of and cause the demand curve for to shift inward; less of each good will be demanded. Conversely, a decrease in the price of will result in a positive movement along the demand curve of and cause the demand curve of to shift outward; more of each good will be demanded. This is in contrast to a substitute good, whose demand decreases when its substitute's price decreases.
Output in economics is the quantity and quality of goods or services produced in a given time period, within a given economic network, whether consumed or used for further production. The economic network may be a firm, industry, or nation. The concept of national output is essential in the field of macroeconomics. It is national output that makes a country rich, not large amounts of money.
A demand curve is a graph depicting the inverse demand function, a relationship between the price of a certain commodity and the quantity of that commodity that is demanded at that price. Demand curves can be used either for the price-quantity relationship for an individual consumer, or for all consumers in a particular market.
There are two fundamental theorems of welfare economics. The first states that in economic equilibrium, a set of complete markets, with complete information, and in perfect competition, will be Pareto optimal. The requirements for perfect competition are these:
- There are no externalities and each actor has perfect information.
- Firms and consumers take prices as given.
In economics, tax incidence or tax burden is the effect of a particular tax on the distribution of economic welfare. Economists distinguish between the entities who ultimately bear the tax burden and those on whom the tax is initially imposed. The tax burden measures the true economic effect of the tax, measured by the difference between real incomes or utilities before and after imposing the tax, and taking into account how the tax causes prices to change. For example, if a 10% tax is imposed on sellers of butter, but the market price rises 8% as a result, most of the tax burden is on buyers, not sellers. The concept of tax incidence was initially brought to economists' attention by the French Physiocrats, in particular François Quesnay, who argued that the incidence of all taxation falls ultimately on landowners and is at the expense of land rent. Tax incidence is said to "fall" upon the group that ultimately bears the burden of, or ultimately suffers a loss from, the tax. The key concept of tax incidence is that the tax incidence or tax burden does not depend on where the revenue is collected, but on the price elasticity of demand and price elasticity of supply. As a general policy matter, the tax incidence should not violate the principles of a desirable tax system, especially fairness and transparency. The concept of tax incidence is used in political science and sociology to analyze the level of resources extracted from each income social stratum in order to describe how the tax burden is distributed among social classes. That allows one to derive some inferences about the progressive nature of the tax system, according to principles of vertical equity.
In economics, demand is the quantity of a good that consumers are willing and able to purchase at various prices during a given time. The relationship between price and quantity demand is also called the demand curve. Demand for a specific item is a function of an item's perceived necessity, price, perceived quality, convenience, available alternatives, purchasers' disposable income and tastes, and many other options.
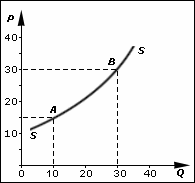
In economics, supply is the amount of a resource that firms, producers, labourers, providers of financial assets, or other economic agents are willing and able to provide to the marketplace or to an individual. Supply can be in produced goods, labour time, raw materials, or any other scarce or valuable object. Supply is often plotted graphically as a supply curve, with the price per unit on the vertical axis and quantity supplied as a function of price on the horizontal axis. This reversal of the usual position of the dependent variable and the independent variable is an unfortunate but standard convention.
In economics, derived demand is demand for a factor of production or intermediate good that occurs as a result of the demand for another intermediate or final good. In essence, the demand for, say, a factor of production by a firm is dependent on the demand by consumers for the product produced by the firm. The term was first introduced by Alfred Marshall in his Principles of Economics in 1890. Demand for all factors of production is considered as derived demand.
Competitive equilibrium is a concept of economic equilibrium, introduced by Kenneth Arrow and Gérard Debreu in 1951, appropriate for the analysis of commodity markets with flexible prices and many traders, and serving as the benchmark of efficiency in economic analysis. It relies crucially on the assumption of a competitive environment where each trader decides upon a quantity that is so small compared to the total quantity traded in the market that their individual transactions have no influence on the prices. Competitive markets are an ideal standard by which other market structures are evaluated.
The North–South model, developed largely by Columbia University economics professor Ronald Findlay, is a model in developmental economics that explains the growth of a less developed "South" or "periphery" economy that interacts through trade with a more developed "North" or "core" economy. The North–South model is used by dependencia theorists as a theoretical economic justification for dependency theory.
A Robinson Crusoe economy is a simple framework used to study some fundamental issues in economics. It assumes an economy with one consumer, one producer and two goods. The title "Robinson Crusoe" is a reference to the 1719 novel of the same name authored by Daniel Defoe.
This glossary of economics is a list of definitions of terms and concepts used in economics, its sub-disciplines, and related fields.

