1970 United Kingdom general election

Last updated

1970 United Kingdom general election
Flag of the United Kingdom.svg
  1966 18 June 1970 Feb 1974  

All 630 seats in the House of Commons
316 seats needed for a majority
Opinion polls
Turnout72.0%, Decrease2.svg3.8%
 First partySecond partyThird party
  Golda Meir and Edward Heath cropped (cropped).jpg Harold Wilson (1967).jpg Liberal Party logo (pre1988).png
Leader Edward Heath Harold Wilson Jeremy Thorpe
Party Conservative Labour Liberal
Leader since 28 July 1965 14 February 1963 18 January 1967
Leader's seat Bexley Huyton North Devon
Last election253 seats, 41.9%364 seats, 48.0%12 seats, 8.5%
Seats won330288 [note 1] 6
Seat changeIncrease2.svg77Decrease2.svg75Decrease2.svg6
Popular vote13,145,12312,208,7582,117,035
Percentage46.4%43.1%7.5%
SwingIncrease2.svg4.5%Decrease2.svg4.9%Decrease2.svg1.0%

UK General Election, 1970.svg
Colours denote the winning party—as shown in § Results

Composition of the Commons in 1970.svg
Composition of the House of Commons after the election

Prime Minister before election

Harold Wilson
Labour

Prime Minister after election

Edward Heath
Conservative

The 1970 United Kingdom general election was held on Thursday 18 June 1970. It resulted in a surprise victory for the Conservative Party under leader Edward Heath, which defeated the governing Labour Party under Prime Minister Harold Wilson. The Liberal Party, under its new leader Jeremy Thorpe, lost half its seats. The Conservatives, including the Ulster Unionist Party (UUP), secured a majority of 30 seats. This general election was the first in which people could vote from the age of 18, after passage of the Representation of the People Act the previous year, and the first UK election where party, and not just candidate names were allowed to be put on the ballots. [1]

Contents

Most opinion polls prior to the election indicated a comfortable Labour victory, and put Labour up to 12.4% ahead of the Conservatives. On election day, however, a late swing gave the Conservatives a 3.4% lead and ended almost six years of Labour government, although Wilson remained leader of the Labour Party in opposition. Writing in the aftermath of the election, the political scientist Richard Rose described the Conservative victory as "surprising" and noted a significant shift in votes between the two main parties. [2] The Times journalist George Clark wrote that the election would be "remembered as the occasion when the people of the United Kingdom hurled the findings of the opinion polls back into the faces of the pollsters". [3]

The result would provide the mandate for Heath as Prime Minister to begin formal negotiations for the United Kingdom to become a member state of the European Communities (EC)—or the "Common Market" as it was more widely known at the time, before it later became the European Union; the UK officially joined the EC on 1 January 1973, along with the Republic of Ireland and Denmark.

Frontbench Labour politicians George Brown and Jennie Lee were voted out at this election.

This marked the end of a series of elections where both main parties won over 40% of the vote. This would not occur again for the Conservatives for nine years; Labour would wait 27. This was also the most recent election at which a House of Commons majority for one party immediately before election day was replaced by a Commons majority for a different party on election day.

The result was cast as a two-party politics outcome, with no third party reaching 10% of the (total) vote. Such an outcome would not happen again until the 2017 election.

The election was the last in which a nationwide UK party gained seats in Northern Ireland. [4] The UUP sat with the Conservative Party at Westminster, traditionally taking the Conservative parliamentary whip. To all intents and purposes the UUP functioned as the Northern Ireland branch of the Conservative Party. However, hardline unionist Ian Paisley unseated the UUP incumbent in North Antrim, a clear sign that the UUP's complete dominance over unionist politics in Northern Ireland was already starting to weaken. In 1972, in protest over the permanent prorogation of the Parliament of Northern Ireland, Westminster UUP MPs withdrew from the alliance. [5] [ page needed ]

Election date

The date of 18 June was supposedly chosen because Harold Wilson wanted as Prime Minister to go to the polls before the introduction of decimal coinage in early 1971, for which his government had been responsible and which he thought was hugely unpopular, [6] [ page needed ] and because Wilson sought to gain some momentum by surprising the Conservatives, who were expecting an October election. [6] [ page needed ]

Overview

Commentators believed that an unexpectedly bad set of balance of payments figures (a £31-million trade deficit) published three days before the election and a loss of national prestige after the England football team's defeat by West Germany on 14 June in the World Cup contributed to the Labour defeat. [7]

Shadow Chancellor Iain Macleod campaigning in York. Iain Macleod.jpg
Shadow Chancellor Iain Macleod campaigning in York.

Other factors that were cited as reasons for the Conservative victory included union indiscipline, rising prices, the risk of devaluation, the imposition of Selective Employment Tax (SET), and a set of jobless figures released on final week of the campaign showing unemployment at its highest level since 1940. Interviewed by Robin Day, the outgoing Prime Minister Harold Wilson highlighted the possibility that "complacency engendered by the opinion polls" may have resulted in a poor turnout of Labour supporters. [8]

As defending world champions, England's venture in the World Cup attracted a much keener public interest than the general election did. [9] However an analysis by pollster Matt Singh for the 50th anniversary of the election concluded that the late swing had been caused by the weak economic data and that there was "no evidence" that the World Cup had influenced the outcome. [10]

American pollster Douglas Schoen and Oxford University academic R. W. Johnson asserted that Enoch Powell had attracted 2.5 million votes to the Conservatives, although the Conservative vote only increased by 1.7 million. Johnson later stated "It became clear that Powell had won the 1970 election for the Tories ... of all those who had switched their vote from one party to another, 50 per cent were working class Powellites". [11] The Professor of Political Science Randall Hansen assessed a range of studies, including some which contended that Powell had made little or no difference to the result, but concluded that "At the very least, Powell's effect was likely to have fired up the Conservative vote in constituencies which would have voted Tory in any event". [12] [ page needed ] Election night commentators Michael Barratt and Jeffrey Preece dismissed any special "Powell factor", as did Conservative MPs Reginald Maudling, Timothy Raison and Hugh Dykes. [8]

The 1970–74 Parliament has to date been the only time since the 1924–29 Parliament in which the Conservative Party were only in government for one term before returning to opposition.

The most notable casualty of the election was George Brown, deputy leader of the Labour Party, who lost to the Conservative candidate in the Belper constituency. Brown had held the seat since 1945. Labour Minister for the Arts, Jennie Lee lost her Cannock seat, held by Labour since 1935 on a swing of 10.7% to the Conservatives in what Richard Rose called "the biggest upset" of the election. [13]

Unusually for the Liberal Party, the by-elections between 1966 and 1970 had proved almost fruitless, with many Liberal candidates losing deposits. The one exception was its by-election gain of Birmingham Ladywood in June 1969; this was promptly lost in the 1970 general election. The party found itself struggling to introduce its new leader Jeremy Thorpe to the public, owing to the extensive coverage and attention paid to Enoch Powell. The election result was poor for the Liberals, with Thorpe only narrowly winning his own seat in North Devon. [7] Indeed, of the six MPs returned, three (Thorpe, David Steel and John Pardoe) were elected by a majority of less than 1,000 votes. [14]

The BBC's election coverage was led by Cliff Michelmore, along with Robin Day, David Butler and Robert McKenzie. [7] There were periodic cutaways to the BBC regions. This coverage has been rerun on BBC Parliament on several occasions, including on 18 July 2005 as a tribute to Edward Heath after his death the previous day. Its most recent screening was on the 20th of June 2020, to commemorate the 50th anniversary of its first transmission. [15] The BBC coverage was parodied by Monty Python's Flying Circus in its famous "Election Night Special" sketch.

Both BBC and ITN carried their 1970 election night broadcasts in colour, although segments broadcast from some remote locations and some BBC and ITN regional bureaus were transmitted in black-and-white. Some ITV regions were not yet broadcasting in colour at the time of the 1970 elections.

The right to vote in this election was widened by the Labour government's Sixth Reform Act, which reduced the voting age from 21 to 18 years. The United Kingdom was the first major democratic nation to extend suffrage to this age group. [16] [17] [18] Case law subsequently established the right for undergraduate students to vote in the constituency of their university. This followed an appeal to the High Court. [19]

Timeline

The Prime Minister, Harold Wilson, visited Buckingham Palace on 18 May and asked the Queen to dissolve Parliament on 29 May, announcing that the election would be held on 18 June. The key dates were as follows:

Friday 29 MayDissolution of the 44th Parliament and campaigning officially begins
Monday 8 JuneLast day to file nomination papers
Wednesday 17 JuneCampaigning officially ends
Thursday 18 JunePolling day
Friday 19 JuneThe Conservative Party wins power with a majority of 31
Monday 29 June 45th Parliament assembles
Thursday 2 July State Opening of Parliament

Opinion poll summary

Summary of the final polling results before the general election. [20]

PartyMarplanGallupNational opinion polls (NOP) Opinion Research Centre (OPC)Harris
Conservative 41.5%42.0%44.1%46.5%46.0%
Labour 50.2%49.0%48.2%45.5%48.0%
Liberal 7.0%7.5%6.4%6.5%5.0%
Other parties 1.3%1.5%1.3%1.5%1.0%
Labour lead8.7%7.0%4.1%1.0%2.0%
Fieldwork dates11–14 June14–16 June12–16 June13–17 June20 May 16 June
Sample size2,2672,1901,5621,5834,841

Results

This was the first general election where 18-year-olds had the right to vote. Therefore, despite 1.1 million more people voting in 1970 compared to 1966, turnout actually fell by 3%. This 72% turnout was the lowest since the 1935 general election and compared with a post-War high of 84% in 1950. Professor Richard Rose described the low turnout, which he noted was "one of the lowest since the introduction of the democratic franchise", as surprising to politician and pollsters. Changes to electoral law as part of the Representation of the People Act 1969 had made postal voting easier and polling stations were open an hour later than in past elections, and this would have been expected to improve turnout. On top of this it was reported by Rose that an estimated 25% of 18- to 21-year-olds who were now eligible to vote had not put their names on the electoral register, meaning the turnout was even lower than the percentage figure suggested. Rose also argued that the turnout figures in Britain were "now among the lowest in the Western world." [2] Because the previous election had been in 1966, some people had not had their chance to vote in a general election until the age of 25. Labour's number of votes, 12.2 million, was ironically the same amount they had needed to win in 1964. The Conservative vote surge cost Labour in many marginal seats. Rose suggested the absolute fall in the number of Labour votes suggested that many of the party's supporters had decided to abstain. He also noted that the Labour Party's local organisation was poorer than that of the Conservatives, but did not feel this was a significant factor in Labour supporters failing to come out to vote for the Party given that this organisational difference had been the case in past elections without having this effect. [2] For the Liberals, a small 1% drop in their vote share saw them lose 6 seats, 3 of which were held by the narrowest of margins.

In the end the Conservatives achieved a swing of 4.7%, enough to give them a comfortable working majority. As for the smaller parties, they increased their number in the Commons from 2 to 6 seats.

The Scottish National Party won its first ever seat at a general election (they had won several by-elections previously, going back as far as 1945), although they did lose Hamilton, which they won in a by-election in 1967.

1970 UK parliament.svg
UK General Election 1970
CandidatesVotes
PartyLeaderStoodElectedGainedUnseatedNet % of total %No.Net %
  Conservative Edward Heath 628330803+7752.446.413,145,123+4.5
  Labour Harold Wilson 625288 [note 1] 1 777645.743.112,208,7584.9
  Liberal Jeremy Thorpe 33260661.07.52,117,0351.0
  Scottish National William Wolfe 65 1 1 0+10.21.1306,802+0.6
  Plaid Cymru Gwynfor Evans 3600000.6175,016+0.4
  Unity N/A5220+20.30.50140,930N/A
  Independent N/A4000000.139,2640.0
  Communist John Gollan 5800000.137,9700.1
  Protestant Unionist Ian Paisley 2 1 1 0+10.20.135,303N/A
  Republican Labour Gerry Fitt 1 1 0000.20.130,649N/A
  Independent Labour N/A3 1 1 0+10.20.124,685+0.1
  Ind. Conservative N/A800000.124,014+0.1
  Democratic Party Desmond Donnelly 500000.115,292N/A
  National Democratic David Brown400000.114,276N/A
  National Front John O'Brien 1000000.011,449N/A
  National Democratic Gerry Quigley 200000.010,349N/A
  Vectis National Party R. W. Cawdell 1 00000.01,607N/A
  Independent Liberal N/A200000.01,4560.0
  World Government Gilbert Young200000.01,016N/A
  Mebyon Kernow Len Truran 1 00000.0960N/A
  Ind. Labour Party Emrys Thomas 1 00000.08470.0
  British Movement Colin Jordan 1 00000.0704N/A
  Independent Progressive 1 00000.0658N/A
  Socialist (GB) N/A200000.03760.0
  Young Ideas Screaming Lord Sutch 1 00000.0142N/A
  British Commonwealth 1 00000.0117N/A
All parties shown. [note 2]
Government's new majority30
Total votes cast28,305,534
Turnout72%

Votes summary

Popular vote
Conservative
46.44%
Labour
43.13%
Liberal
7.48%
SNP
1.08%
Others
1.86%

Seats summary

Parliamentary seats
Conservative
52.38%
Labour
45.71%
Liberal
0.95%
SNP
0.16%
Others
0.79%

Televised declarations

These declarations were covered live by the BBC where the returning officer was heard to say "duly elected".

From BBC Parliament Replay
ConstituencyWinning party 1966Constituency result by partyWinning party 1970
ConLabLibOthers
Guildford Conservative 27,20313,1088,822 Conservative hold
Cheltenham Conservative 22,82314,2138,431 Conservative hold
Salford West Labour 14,31016,986 Labour hold
Wolverhampton North East Labour 15,35817,2511,592 Labour hold
Salford East Labour 9,58315,8533,000 Labour hold
Wolverhampton South West Conservative 26,25211,7532,459318 Conservative hold
Newcastle upon Tyne Central Labour 4,25613,6711,433 Labour hold
Newcastle upon Tyne North Conservative 15,97812,518 Conservative hold
Exeter Labour 21,68020,4096,672 Conservative gain
North Devon Liberal 18,5245,26818,893175 Liberal hold
West Aberdeenshire Liberal 18,3966,14112,8472,112 Conservative gain

Incumbents defeated

PartyNameConstituencyOffice held whilst in Parliament or by-electionDefeated byParty
Labour Donald Dewar Aberdeen South Iain Sproat Conservative
Edwin Brooks Bebington Eric Cockeram Conservative
Brian Parkyn Bedford Trevor Skeet Conservative
Gwilym Roberts Bedfordshire South David Madel Conservative
George Brown Belper Deputy Leader of the Labour Party Geoffrey Stewart-Smith Conservative
Eric Moonman Billericay Robert McCrindle Conservative
Christopher Price Birmingham Perry Barr Joseph Kinsey Conservative
Ioan Evans Birmingham Yardley Comptroller of the Household Derek Coombs Conservative
Robert Howarth Bolton East Laurance Reed Conservative
Gordon Oakes Bolton West Robert Redmond Conservative
Woodrow Wyatt Bosworth Adam Butler Conservative
Norman Haseldine Bradford West John Wilkinson Conservative
Colin Jackson Brighouse and Spenborough Wilfred Proudfoot Conservative
Dennis Hobden Brighton Kemptown Andrew Bowden Conservative
Raymond Dobson Bristol North East Assistant Whip Robert Adley Conservative
John Ellis Bristol North West Martin McLaren Conservative
Robert Maxwell Buckingham William Benyon Conservative
Jennie Lee Cannock Minister for the Arts Patrick Cormack Conservative
Ted Rowlands Cardiff North Michael Roberts Conservative
Alistair Macdonald Chislehurst Patricia Hornsby-Smith Conservative
Ednyfed Hudson Davies Conway Wyn Roberts Conservative
David Winnick Croydon South Richard Thompson Conservative
Sydney Irving Dartford Chairman of Ways and Means Peter Trew Conservative
David Ennals Dover Minister of State for Social Services Peter Rees Conservative
Stan Newens Epping Norman Tebbit Conservative
Gwyneth Dunwoody Exeter Parliamentary Secretary at the Board of Trade John Hannam Conservative
John Dunwoody Falmouth and Camborne David Mudd Conservative
Terence Boston Faversham Roger Moate Conservative
John Diamond Gloucester Chief Secretary to the Treasury Sally Oppenheim Conservative
Albert Murray Gravesend Parliamentary Secretary to the Ministry of Transport Roger White Conservative
Ben Whitaker Hampstead Parliamentary Secretary to the Minister of Overseas Development Geoffrey Finsberg Conservative
Roy Roebuck Harrow East Hugh Dykes Conservative
Peter Jackson High Peak Spencer Le Marchant Conservative
Alan Lee Williams Hornchurch John Loveridge Conservative
Arnold Shaw Ilford South Albert Cooper Conservative
Dingle Foot Ipswich Solicitor General for England and Wales Ernle Money Conservative
John Binns Keighley Joan Hall Conservative
John Page King's Lynn Christopher Brocklebank-Fowler Conservative
Stanley Henig Lancaster Elaine Kellett-Bowman Conservative
Harold Davies Leek Parliamentary Private Secretary to the Prime Minister David Knox Conservative
James Dickens Lewisham West John Gummer Conservative
William Howie Luton Comptroller of the Household Charles Simeons Conservative
Jeremy Bray Middlesbrough West John Sutcliffe Conservative
Denis Coe Middleton and Prestwich Alan Haselhurst Conservative
Donald Anderson Monmouth John Stradling Thomas Conservative
Bert Hazell Norfolk North Ralph Howell Conservative
George Perry Nottingham South Norman Fowler Conservative
John Horner Oldbury and Halesowen John Stokes Conservative
Evan Luard Oxford Montague Woodhouse Conservative
Ronald Atkins Preston North Mary Holt Conservative
Peter Mahon Preston South Alan Green Conservative
John Lee Reading Gerard Vaughan Conservative
Anne Kerr Rochester and Chatham Peggy Fenner Conservative
Antony Gardner Rushcliffe Kenneth Clarke Conservative
Frank Hooley Sheffield Heeley John Spence Conservative
Bob Mitchell Southampton Test James Hill Conservative
Arnold Gregory Stockport North Idris Owen Conservative
Ernest Davies Stretford Winston Churchill Conservative
Gerald Fowler The Wrekin Anthony Trafford Conservative
John Ryan Uxbridge Charles Curran Conservative
Malcolm Macmillan Western Isles Donald Stewart Scottish National Party
Hugh Gray Yarmouth Anthony Fell Conservative
Conservative Kenneth Baker Acton Elected in the 1968 Acton by-election Nigel Spearing Labour
Donald Williams Dudley Elected in the 1968 Dudley by-election John Gilbert Labour
Esmond Wright Glasgow Pollok Elected in the 1967 Glasgow Pollok by-election James White Labour
Bruce Campbell Oldham West Elected in the 1968 Oldham West by-election Michael Meacher Labour
Christopher Ward Swindon Elected in the 1969 Swindon by-election David Stoddart Labour
Fred Silvester Walthamstow West Elected in the 1967 Walthamstow West by-election Eric Deakins Labour
Liberal Wallace Lawler Birmingham Ladywood Elected in the 1969 Birmingham Ladywood by-election Doris Fisher Labour
Michael Winstanley Cheadle Tom Normanton Conservative
Richard Wainwright Colne Valley David Clark Labour
Eric Lubbock Orpington Liberal Chief Whip Ivor Stanbrook Conservative
Alasdair Mackenzie Ross and Cromarty Hamish Gray Conservative
Ulster Unionist Henry Clark Antrim North Ian Paisley Democratic Unionist
James Hamilton Fermanagh and South Tyrone Frank McManus Unity
Scottish National Party Winnie Ewing Hamilton Elected in the 1967 Hamilton by-election Alex Wilson Labour
Plaid Cymru Gwynfor Evans Carmarthen Elected in the 1966 Carmarthen by-election Gwynoro Jones Labour
Democratic Party Desmond Donnelly Pembrokeshire Former Labour MP Nicholas Edwards Conservative

See also

Notes

  1. 1 2 The seat and vote count figures for Labour given here include the Speaker of the House of Commons
  2. The Conservative figure includes eight Ulster Unionists, and the Labour figure includes seven Northern Ireland Labour Party candidates.

Related Research Articles

<span class="mw-page-title-main">2001 United Kingdom general election</span>

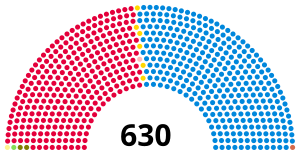
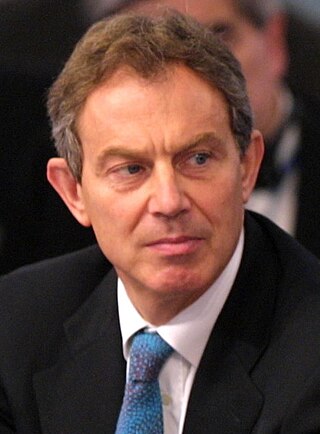
The 2001 United Kingdom general election was held on Thursday 7 June 2001, four years after the previous election on 1 May 1997, to elect 659 members to the House of Commons. The governing Labour Party was re-elected to serve a second term in government with another landslide victory with a 167-seat majority, returning 412 members of Parliament versus 418 from the 1997 general election, a net loss of six seats, though with a significantly lower turnout than before—59.4%, compared to 71.6% at the previous election. The number of votes Labour received fell by nearly three million. Tony Blair went on to become the only Labour Prime Minister to serve two consecutive full terms in office. As Labour retained almost all of their seats won in the 1997 landslide victory, the media dubbed the 2001 election "the quiet landslide".

<span class="mw-page-title-main">1979 United Kingdom general election</span>

The 1979 United Kingdom general election was held on Thursday 3 May 1979 to elect 635 members to the House of Commons.

<span class="mw-page-title-main">1987 United Kingdom general election</span>

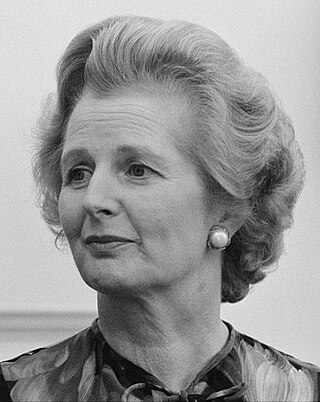
The 1987 United Kingdom general election was held on Thursday 11 June 1987, to elect 650 members to the House of Commons. The election was the third consecutive general election victory for the Conservative Party, who won a majority of 102 seats and second landslide under the leadership of Margaret Thatcher, who became the first Prime Minister since the Earl of Liverpool in 1820 to lead a party into three successive electoral victories.

<span class="mw-page-title-main">February 1974 United Kingdom general election</span>

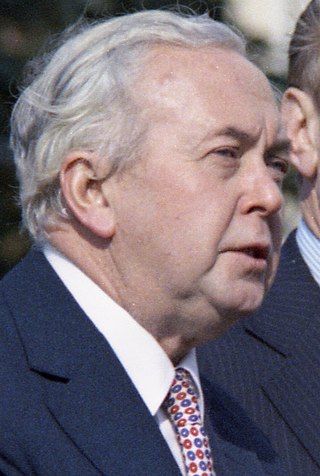
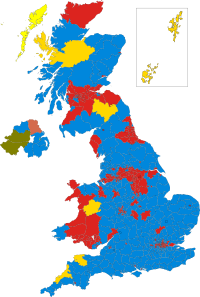
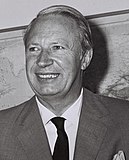
The February 1974 United Kingdom general election was held on Thursday 28 February 1974. The Labour Party, led by Leader of the Opposition and former Prime Minister Harold Wilson, gained 14 seats but was seventeen short of an overall majority. The Conservative Party, led by incumbent Prime Minister Edward Heath, lost 28 seats. That resulted in a hung parliament, the first since 1929. Heath sought a coalition with the Liberals, but the two parties failed to come to an agreement and so Wilson became Prime Minister for a second time, his first with a minority government. Wilson called another early election in September, which was held in October and resulted in a Labour majority. The February election was also the first general election to be held with the United Kingdom as a member state of the European Communities (EC), which was widely known as the "Common Market".

<span class="mw-page-title-main">October 1974 United Kingdom general election</span>

The October 1974 United Kingdom general election took place on Thursday 10 October 1974 to elect 635 members of the House of Commons. It was the second general election held that year; the first year that two general elections were held in the same year since 1910; and the first time that two general elections were held less than a year apart from each other since the 1923 and 1924 elections, which took place 10 months apart. The election resulted in the Labour Party, led by Prime Minister Harold Wilson, winning a bare majority of three seats. That enabled the remainder of the Labour government to take place, but it saw a gradual loss of its majority.

<span class="mw-page-title-main">1964 United Kingdom general election</span>

The 1964 United Kingdom general election was held on Thursday 15 October 1964. It resulted in the Conservatives, led by incumbent Prime Minister Alec Douglas-Home, narrowly losing to the Labour Party, led by Harold Wilson; Labour secured a parliamentary majority of four seats and ended its thirteen years in opposition since the 1951 election. Wilson became the youngest Prime Minister since Lord Rosebery in 1894. To date, this is also the most narrow majority obtained in the House of Commons, with just one seat clearing Labour for a majority government.

<span class="mw-page-title-main">1966 United Kingdom general election</span>

The 1966 United Kingdom general election was held on Thursday 31 March 1966. The result was a landslide victory for the Labour Party led by incumbent Prime Minister Harold Wilson.

<span class="mw-page-title-main">1950 United Kingdom general election</span>

The 1950 United Kingdom general election was the first to be held after a full term of a majority Labour government. The general election was held on Thursday 23 February 1950, and was also the first to be held following the abolition of plural voting and university constituencies. The government's lead over the Conservative Party shrank dramatically, and Labour was returned to power but with an overall majority significantly reduced from 146 to just 5. There was a 2.8% national swing towards the Conservatives, who gained 90 seats. Labour called another general election the following year, which the Conservative Party won, returning Churchill to government after six years in opposition.

<span class="mw-page-title-main">1959 United Kingdom general election</span> 8 October 1959

The 1959 United Kingdom general election was held on Thursday, 8 October 1959. It marked a third consecutive victory for the ruling Conservative Party, now led by Prime Minister Harold Macmillan. For the second time in a row, the Conservatives increased their overall majority in Parliament, this time to a landslide majority of 100 seats, having gained 20 seats for a return of 365. The Labour Party, led by Hugh Gaitskell, lost 19 seats and returned 258. The Liberal Party, led by Jo Grimond, again returned only six MPs to the House of Commons, but managed to increase its overall share of the vote to 5.9%, compared to just 2.7% four years earlier.

<span class="mw-page-title-main">1999 European Parliament election in the United Kingdom</span>

The 1999 European Parliament election was the United Kingdom's part of the European Parliament election 1999. It was held on 10 June 1999. Following the European Parliamentary Elections Act 1999, it was the first European election to be held in the United Kingdom where the whole country used a system of proportional representation. In total, 87 Members of the European Parliament were elected from the United Kingdom across twelve new regional constituencies.

<span class="mw-page-title-main">2004 European Parliament election in the United Kingdom</span> Election

The 2004 European Parliament election was the United Kingdom's part of the wider 2004 European Parliament election which was held between 10 and 13 June 2004 in the 25 member states of the European Union. The United Kingdom's part of this election was held on Thursday 10 June 2004. The election also coincided with the 2004 local elections and the London Assembly and mayoral elections. In total, 78 Members of the European Parliament were elected from the United Kingdom using proportional representation.

<span class="mw-page-title-main">Fermanagh and South Tyrone (UK Parliament constituency)</span> Parliamentary constituency in the United Kingdom, 1950 onwards

Fermanagh and South Tyrone is a parliamentary constituency in the British House of Commons. The current MP is Michelle Gildernew of Sinn Féin.

<span class="mw-page-title-main">Belfast North (UK Parliament constituency)</span> Parliamentary constituency in the United Kingdom, 1885–1918 and since 1922

Belfast North is a parliamentary constituency in the United Kingdom House of Commons. The current MP is John Finucane of Sinn Féin.

<span class="mw-page-title-main">North Down (UK Parliament constituency)</span> Parliamentary constituency in the United Kingdom, 1950 onwards

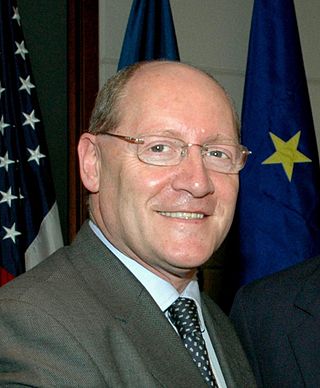
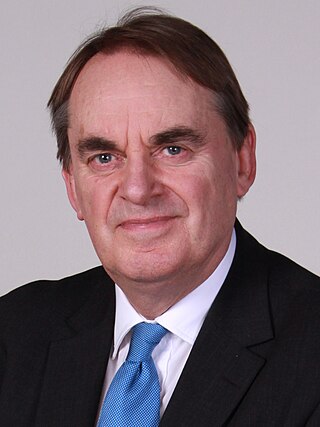
North Down is a parliamentary constituency in the United Kingdom House of Commons. The current MP is Stephen Farry of the Alliance Party. Farry was elected to the position in the 2019 general election, replacing the incumbent Sylvia Hermon. Hermon had held the position since being elected to it in the 2001 general election, but chose not to contest in 2019.

<span class="mw-page-title-main">2005 United Kingdom general election</span>

The 2005 United Kingdom general election was held on Thursday 5 May 2005, to elect 646 members to the House of Commons. The governing Labour Party, led by Tony Blair, won its third consecutive victory, with Blair becoming the second Labour leader after Harold Wilson to form three majority governments. However, its majority fell to 66 seats; the majority it won four years earlier had been of 167 seats. This would be the last election not won by the Conservative Party as of 2024. This was the first time the Labour Party had won a third consecutive election, and as of the 2024 general election remains the party's most recent general election victory.

<span class="mw-page-title-main">2010 United Kingdom general election</span>

The 2010 United Kingdom general election was held on Thursday 6 May 2010, with 45,597,461 registered voters entitled to vote to elect members to the House of Commons. The election took place in 650 constituencies across the United Kingdom under the first-past-the-post system.

<span class="mw-page-title-main">2009 European Parliament election in the United Kingdom</span> European Parliament elections in the United Kingdom

The 2009 European Parliament election was the United Kingdom's component of the 2009 European Parliament election, the voting for which was held on Thursday 4 June 2009. The election was held concurrently with the 2009 local elections in England. In total, 72 Members of the European Parliament were elected from the United Kingdom using proportional representation.

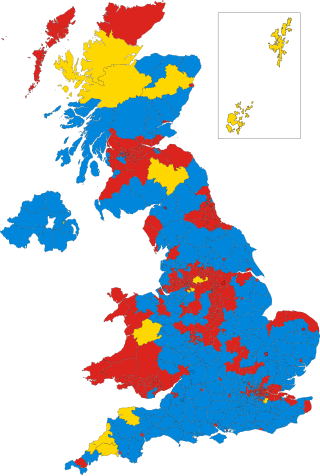
This is the results breakdown of the 2010 United Kingdom general election.

<span class="mw-page-title-main">2015 United Kingdom general election</span>

The 2015 United Kingdom general election was held on Thursday 7 May 2015 to elect 650 Members of Parliament to the House of Commons. It was the only general election held under the rules of the Fixed-term Parliaments Act 2011 and was the last general election to be held before the United Kingdom would vote to end its membership of the European Union (EU). Local elections took place in most areas of England on the same day.

Prior to the 2019 United Kingdom general election, various organisations carried out opinion polling to gauge voting intentions. Results of such polls are displayed in this list. Most of the pollsters listed are members of the British Polling Council (BPC) and abide by its disclosure rules. Opinion polling about attitudes to the leaders of various political parties can be found in a separate article.

References

  1. HC Deb 10 December 1968 vol 775 cc242-87
  2. 1 2 3 Richard Rose (1970). "Voting Trends Surveyed". The Times Guide to the House of Commons 1970. London: Times Newspapers Limited. p. 31.
  3. George Clark (1970). "The General Election Campaign, 1970". The Times Guide to the House of Commons 1970. London: Times Newspapers Limited. p. 26.
  4. Keohane, Dan (2000), Security in British Politics 1945–99, p. 183
  5. Bell, Stuart; Seldon, Anthony, The Heath Government 1970–74: A Reappraisal
  6. 1 2 Haines, Joe (2003), Glimmers of Twilight, London: Politico's Publishers
  7. 1 2 3 "1970: Heath's surprise victory", BBC News, 5 April 2005, retrieved 31 May 2018
  8. 1 2 BBC Election Results Programme, 18–19 July 1970
  9. "Heath: The victory few predicted", BBC News, retrieved 31 May 2018
  10. "Did England's World Cup defeat win the 1970 election for the Tories?". CapX. 19 June 2020. Retrieved 19 June 2020.
  11. Heffer, Simon (1999), Like the Roman: The Life of Enoch Powell, London: Phoenix, p. 568
  12. Hansen, Randell (2000), Citizenship and Immigration in Post-War Britain, Oxford University Press
  13. Richard Rose (1970). "Voting Trends Surveyed". The Times Guide to the House of Commons 1970. London: Times Newspapers Ltd. p. 31.
  14. The Times Guide to the House of Commons 1970. London: Times Newspapers Ltd. 1970. p. 250.
  15. BBC Election 1970, BBC Parliament, archived from the original on 25 October 2010
  16. Loughran, Thomas; Mycock, Andrew; Tonge, Jonathan (3 April 2021). "A coming of age: how and why the UK became the first democracy to allow votes for 18-year-olds". Contemporary British History. 35 (2): 284–313. doi:10.1080/13619462.2021.1890589. ISSN   1361-9462. S2CID   233956982.
  17. Loughran, Thomas; Mycock, Andrew; Tonge, Jonathan (3 November 2021). "Lowering the voting age: three lessons from the 1969 Representation of the People's Act". British Politics and Policy at LSE. Retrieved 31 December 2022.
  18. Bingham, Adrian (25 June 2019). "'The last milestone' on the journey to full adult suffrage? 50 years of debates about the voting age". History & Policy. Retrieved 31 December 2022.
  19. Stephen D. Fisher & Nick Hillman. "Do students swing elections? Registration, turnout and voting behaviour among full-time students" (PDF). HEPI. p. 4.
  20. Abrams, M. (1970), "The Opinion Polls and the 1970 British General Election", The Public Opinion Quarterly, 34 (2): 317–324, doi:10.1086/267808

Further reading

Manifestos