Analysis of variance (ANOVA) is a collection of statistical models and their associated estimation procedures used to analyze the differences among means. ANOVA was developed by the statistician Ronald Fisher. ANOVA is based on the law of total variance, where the observed variance in a particular variable is partitioned into components attributable to different sources of variation. In its simplest form, ANOVA provides a statistical test of whether two or more population means are equal, and therefore generalizes the t-test beyond two means. In other words, the ANOVA is used to test the difference between two or more means.

In probability theory and statistics, variance is the expectation of the squared deviation of a random variable from its population mean or sample mean. Variance is a measure of dispersion, meaning it is a measure of how far a set of numbers is spread out from their average value. Variance has a central role in statistics, where some ideas that use it include descriptive statistics, statistical inference, hypothesis testing, goodness of fit, and Monte Carlo sampling. Variance is an important tool in the sciences, where statistical analysis of data is common. The variance is the square of the standard deviation, the second central moment of a distribution, and the covariance of the random variable with itself, and it is often represented by , , , , or .

In statistics, the Pearson correlation coefficient ― also known as Pearson's r, the Pearson product-moment correlation coefficient (PPMCC), the bivariate correlation, or colloquially simply as the correlation coefficient ― is a measure of linear correlation between two sets of data. It is the ratio between the covariance of two variables and the product of their standard deviations; thus, it is essentially a normalized measurement of the covariance, such that the result always has a value between −1 and 1. As with covariance itself, the measure can only reflect a linear correlation of variables, and ignores many other types of relationships or correlations. As a simple example, one would expect the age and height of a sample of teenagers from a high school to have a Pearson correlation coefficient significantly greater than 0, but less than 1.
An F-test is any statistical test in which the test statistic has an F-distribution under the null hypothesis. It is most often used when comparing statistical models that have been fitted to a data set, in order to identify the model that best fits the population from which the data were sampled. Exact "F-tests" mainly arise when the models have been fitted to the data using least squares. The name was coined by George W. Snedecor, in honour of Ronald Fisher. Fisher initially developed the statistic as the variance ratio in the 1920s.
In statistics, an effect size is a value measuring the strength of the relationship between two variables in a population, or a sample-based estimate of that quantity. It can refer to the value of a statistic calculated from a sample of data, the value of a parameter for a hypothetical population, or to the equation that operationalizes how statistics or parameters lead to the effect size value. Examples of effect sizes include the correlation between two variables, the regression coefficient in a regression, the mean difference, or the risk of a particular event happening. Effect sizes complement statistical hypothesis testing, and play an important role in power analyses, sample size planning, and in meta-analyses. The cluster of data-analysis methods concerning effect sizes is referred to as estimation statistics.

In statistics, multivariate analysis of variance (MANOVA) is a procedure for comparing multivariate sample means. As a multivariate procedure, it is used when there are two or more dependent variables, and is often followed by significance tests involving individual dependent variables separately.
In probability theory and statistics, the coefficient of variation (CV), also known as relative standard deviation (RSD), is a standardized measure of dispersion of a probability distribution or frequency distribution. It is often expressed as a percentage, and is defined as the ratio of the standard deviation to the mean . The CV or RSD is widely used in analytical chemistry to express the precision and repeatability of an assay. It is also commonly used in fields such as engineering or physics when doing quality assurance studies and ANOVA gauge R&R, by economists and investors in economic models, and in neuroscience.
Linear discriminant analysis (LDA), normal discriminant analysis (NDA), or discriminant function analysis is a generalization of Fisher's linear discriminant, a method used in statistics and other fields, to find a linear combination of features that characterizes or separates two or more classes of objects or events. The resulting combination may be used as a linear classifier, or, more commonly, for dimensionality reduction before later classification.

In statistics, the coefficient of determination, denoted R2 or r2 and pronounced "R squared", is the proportion of the variation in the dependent variable that is predictable from the independent variable(s).
In statistics, the number of degrees of freedom is the number of values in the final calculation of a statistic that are free to vary.
A measurement systems analysis (MSA) is a thorough assessment of a measurement process, and typically includes a specially designed experiment that seeks to identify the components of variation in that measurement process. Just as processes that produce a product may vary, the process of obtaining measurements and data may also have variation and produce incorrect results. A measurement systems analysis evaluates the test method, measuring instruments, and the entire process of obtaining measurements to ensure the integrity of data used for analysis and to understand the implications of measurement error for decisions made about a product or process. Proper measurement system analysis is critical for producing a consistent product in manufacturing and when left uncontrolled can result in a drift of key parameters and unusable final products. MSA is also an important element of Six Sigma methodology and of other quality management systems. MSA analyzes the collection of equipment, operations, procedures, software and personnel that affects the assignment of a number to a measurement characteristic.
In statistics, Levene's test is an inferential statistic used to assess the equality of variances for a variable calculated for two or more groups. Some common statistical procedures assume that variances of the populations from which different samples are drawn are equal. Levene's test assesses this assumption. It tests the null hypothesis that the population variances are equal. If the resulting p-value of Levene's test is less than some significance level (typically 0.05), the obtained differences in sample variances are unlikely to have occurred based on random sampling from a population with equal variances. Thus, the null hypothesis of equal variances is rejected and it is concluded that there is a difference between the variances in the population.
In statistics, the fraction of variance unexplained (FVU) in the context of a regression task is the fraction of variance of the regressand Y which cannot be explained, i.e., which is not correctly predicted, by the explanatory variables X.
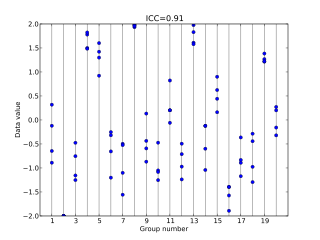
In statistics, the intraclass correlation, or the intraclass correlation coefficient (ICC), is a descriptive statistic that can be used when quantitative measurements are made on units that are organized into groups. It describes how strongly units in the same group resemble each other. While it is viewed as a type of correlation, unlike most other correlation measures it operates on data structured as groups, rather than data structured as paired observations.
In statistics, one-way analysis of variance is a technique that can be used to compare whether two sample's means are significantly different or not. This technique can be used only for numerical response data, the "Y", usually one variable, and numerical or (usually) categorical input data, the "X", always one variable, hence "one-way".
The Brown–Forsythe test is a statistical test for the equality of group variances based on performing an Analysis of Variance (ANOVA) on a transformation of the response variable. When a one-way ANOVA is performed, samples are assumed to have been drawn from distributions with equal variance. If this assumption is not valid, the resulting F-test is invalid. The Brown–Forsythe test statistic is the F statistic resulting from an ordinary one-way analysis of variance on the absolute deviations of the groups or treatments data from their individual medians.
In statistics, the reduced chi-square statistic is used extensively in goodness of fit testing. It is also known as mean squared weighted deviation (MSWD) in isotopic dating and variance of unit weight in the context of weighted least squares.
Fourier amplitude sensitivity testing (FAST) is a variance-based global sensitivity analysis method. The sensitivity value is defined based on conditional variances which indicate the individual or joint effects of the uncertain inputs on the output.
In statistics, the two-way analysis of variance (ANOVA) is an extension of the one-way ANOVA that examines the influence of two different categorical independent variables on one continuous dependent variable. The two-way ANOVA not only aims at assessing the main effect of each independent variable but also if there is any interaction between them.
In statistics, expected mean squares (EMS) are the expected values of certain statistics arising in partitions of sums of squares in the analysis of variance (ANOVA). They can be used for ascertaining which statistic should appear in the denominator in an F-test for testing a null hypothesis that a particular effect is absent.


