Biography
Marcus was always interested in both science and technology as well as visual communication. He grew up in Omaha, Nebraska, in the 1950s, he was interested in astronomy and paleontology, and drawing cartoons. He learned painting, and calligraphy. In secondary school, he studied science and art, and was editor of his high-school newspaper. [2]
He graduated with an A.B. in physics from Princeton University in 1965 after completing a senior thesis, titled "Determination of the (1,0,0) electronic effective mass in a gallium phosphide semiconductor by means of Raman scattering", under the supervision of John Hopfield. [3] He obtained his BFA and MFA in 1968 at Yale University’s School of Art and Architecture. He learned about painting, drawing, printmaking, and letterpress printing workshops informally, photography, and art history. He also learned about book design, calligraphy, color, graphic design, drawing, film making, printing, printmaking, painting, typography, and photography.
At Yale, while a design graduate student, he also began the study of computer graphics, taking a course in basic functioning of computers, and he learned FORTRAN programming at the Yale Computer Center in the summer of 1966.
Work
In 1967, Marcus spent a summer making ASCII art as a researcher at AT&T’s Bell Laboratories in Murray Hill, New Jersey.
From 1968 to 1977, in the School of Architecture and Urban Planning and in the Visual Arts Program, he taught at Princeton University: color, computer art, computer graphics, concrete/visual poetry, environmental graphics, exhibit design, graphic design, history/philosophy of design/visual communication, information design, information visualization, layout, publication design, systematic design, semiotics/semiologie, typography, and visual design.
In 1969-1971, he programmed a prototype desktop publishing page-layout application for AT&T Bell Labs. In 1971-1973, he claims to have programmed some of the first virtual reality art/design spaces ever created while a faculty member at Princeton University.
In the early 1980s, he was a Staff Scientist at Lawrence Berkeley Laboratory in Berkeley, as well as a faculty member of the University of California at Berkeley’s College of Environmental Design. [4]
In 1982, he founded Aaron Marcus and Associates, Inc. (AM+A), a user-interface design and consulting company, one of the first such independent, computer-based design firms in the world.

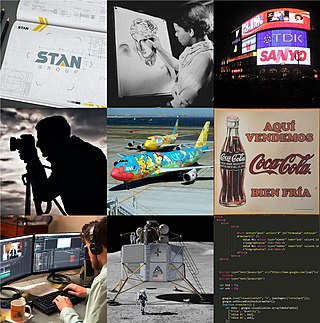
Graphic design is a profession, academic discipline and applied art whose activity consists in projecting visual communications intended to transmit specific messages to social groups, with specific objectives. Graphic design is an interdisciplinary branch of design and of the fine arts. Its practice involves creativity, innovation and lateral thinking using manual or digital tools, where it is usual to use text and graphics to communicate visually.
Desktop publishing (DTP) is the creation of documents using page layout software on a personal ("desktop") computer. It was first used almost exclusively for print publications, but now it also assists in the creation of various forms of online content. Desktop publishing software can generate layouts and produce typographic-quality text and images comparable to traditional typography and printing. Desktop publishing is also the main reference for digital typography. This technology allows individuals, businesses, and other organizations to self-publish a wide variety of content, from menus to magazines to books, without the expense of commercial printing.

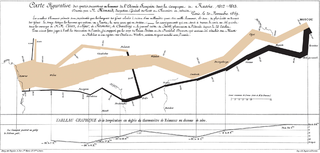
Information design is the practice of presenting information in a way that fosters an efficient and effective understanding of the information. The term has come to be used for a specific area of graphic design related to displaying information effectively, rather than just attractively or for artistic expression. Information design is closely related to the field of data visualization and is often taught as part of graphic design courses. The broad applications of information design along with its close connections to other fields of design and communication practices have created some overlap in the definitions of communication design, data visualization, and information architecture.
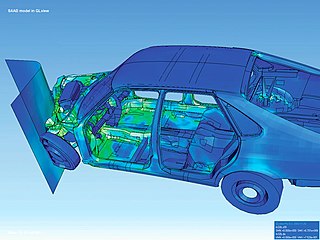
Graphics are visual images or designs on some surface, such as a wall, canvas, screen, paper, or stone, to inform, illustrate, or entertain. In contemporary usage, it includes a pictorial representation of data, as in design and manufacture, in typesetting and the graphic arts, and in educational and recreational software. Images that are generated by a computer are called computer graphics.

Visualization or visualisation is any technique for creating images, diagrams, or animations to communicate a message. Visualization through visual imagery has been an effective way to communicate both abstract and concrete ideas since the dawn of humanity. Examples from history include cave paintings, Egyptian hieroglyphs, Greek geometry, and Leonardo da Vinci's revolutionary methods of technical drawing for engineering and scientific purposes.

Infographics are graphic visual representations of information, data, or knowledge intended to present information quickly and clearly. They can improve cognition by utilizing graphics to enhance the human visual system's ability to see patterns and trends. Similar pursuits are information visualization, data visualization, statistical graphics, information design, or information architecture. Infographics have evolved in recent years to be for mass communication, and thus are designed with fewer assumptions about the readers' knowledge base than other types of visualizations. Isotypes are an early example of infographics conveying information quickly and easily to the masses.
Zuzana Licko is a Slovak-born American type designer and visual artist known for co-founding Emigre Fonts, a digital type foundry in Berkeley, CA. She has designed and produced numerous digital typefaces including the popular Mrs Eaves, Modula, Filosofia, and Matrix. As a corresponding interest she also creates ceramic sculptures, textile prints and jacquard weavings.

A graphic designer is a professional within the graphic design and graphic arts industry who assembles together images, typography, or motion graphics to create a piece of design. A graphic designer creates the graphics primarily for published, printed, or electronic media, such as brochures and advertising. They are also sometimes responsible for typesetting, illustration, user interfaces. A core responsibility of the designer's job is to present information in a way that is both accessible and memorable.

Ben Shneiderman is an American computer scientist, a Distinguished University Professor in the University of Maryland Department of Computer Science, which is part of the University of Maryland College of Computer, Mathematical, and Natural Sciences at the University of Maryland, College Park, and the founding director (1983-2000) of the University of Maryland Human-Computer Interaction Lab. He conducted fundamental research in the field of human–computer interaction, developing new ideas, methods, and tools such as the direct manipulation interface, and his eight rules of design.

Motion graphic design, also known as motion design, is a subset of graphic design which combines design with animation and/or filmmaking, video production, and filmic techniques. Examples include kinetic typography and graphics used in film and television opening sequences, and station identification logos of some television channels.

Ladislav Sutnar was a graphic designer from Plzeň, Czechoslovakia who was a pioneer of information design and information architecture. Although he is uncredited, his contributions to business organization benefited society, which included creating a user-friendly telephone directory by implementing parenthetical area codes. He received design commissions from a variety of employers, including McGraw-Hill, IBM, and the United Nations. He also worked as art director for Sweet's Catalog Service for almost twenty years. Sutnar held many one-man exhibitions, and his work is on permanent display in MoMA. He is best known for his books, including Controlled Visual Flow: Shape, Line and Color, Package Design: The Force of Visual Selling, and Visual Design in Action: Principles, Purposes. Sutnar was a master of exhibition design, typography, advertising, posters, magazine and book design.
Graphic design careers include creative director, art director, art production manager, brand identity developer, illustrator and layout artist.

Data and information visualization is the practice of designing and creating easy-to-communicate and easy-to-understand graphic or visual representations of a large amount of complex quantitative and qualitative data and information with the help of static, dynamic or interactive visual items. Typically based on data and information collected from a certain domain of expertise, these visualizations are intended for a broader audience to help them visually explore and discover, quickly understand, interpret and gain important insights into otherwise difficult-to-identify structures, relationships, correlations, local and global patterns, trends, variations, constancy, clusters, outliers and unusual groupings within data. When intended for the general public to convey a concise version of known, specific information in a clear and engaging manner, it is typically called information graphics.

April Greiman is an American designer widely recognized as one of the first designers to embrace computer technology as a design tool. Greiman is also credited, along with early collaborator Jayme Odgers, with helping to import the European New Wave design style to the US during the late 70s and early 80s." According to design historian Steven Heller, “April Greiman was a bridge between the modern and postmodern, the analog and the digital.” “She is a pivotal proponent of the ‘new typography’ and new wave that defined late twentieth-century graphic design.” Her art combines her Swiss design training with West Coast postmodernism.

Steven Heller is an American art director, journalist, critic, author, and editor who specializes in topics related to graphic design.
User experience design is the process of defining the experience a user would go through when interacting with a company, its services, and its products. Design decisions in UX design are often driven by research, data analysis, and test results rather than aesthetic preferences and opinions. Unlike user interface design, which focuses solely on the design of a computer interface, UX design encompasses all aspects of a user's perceived experience with a product or website, such as its usability, usefulness, desirability, brand perception, and overall performance. UX design is also an element of the customer experience (CX), which encompasses all aspects and stages of a customer's experience and interaction with a company.

Ellen Lupton is a graphic designer, curator, writer, critic, and educator. Known for her love of typography, Lupton is the Betty Cooke and William O. Steinmetz Design Chair at Maryland Institute College of Art. Previously she was the Senior Curator of Contemporary Design at Cooper Hewitt, Smithsonian Design Museum in New York City and was named Curator Emerita after 30 years of service. She is the founding director of the Graphic Design M.F.A. degree program at Maryland Institute College of Art (MICA), where she also serves as director of the Center for Design Thinking. She has written numerous books on graphic design for a variety of audiences. She has contributed to several publications, including Print, Eye, I.D., Metropolis, and The New York Times.
Jock D. Mackinlay is an American information visualization expert and Vice President of Research and Design at Tableau Software. With Stuart Card, George G. Robertson and others he invented a number of information visualization techniques.

An interaction technique, user interface technique or input technique is a combination of hardware and software elements that provides a way for computer users to accomplish a single task. For example, one can go back to the previously visited page on a Web browser by either clicking a button, pressing a key, performing a mouse gesture or uttering a speech command. It is a widely used term in human-computer interaction. In particular, the term "new interaction technique" is frequently used to introduce a novel user interface design idea.


