In statistics, an estimator is a rule for calculating an estimate of a given quantity based on observed data: thus the rule, the quantity of interest and its result are distinguished. For example, the sample mean is a commonly used estimator of the population mean.
The likelihood function is the joint probability of observed data viewed as a function of the parameters of a statistical model.

In probability theory and statistics, the gamma distribution is a two-parameter family of continuous probability distributions. The exponential distribution, Erlang distribution, and chi-squared distribution are special cases of the gamma distribution. There are two equivalent parameterizations in common use:
- With a shape parameter and a scale parameter .
- With a shape parameter and an inverse scale parameter , called a rate parameter.
In probability and statistics, an exponential family is a parametric set of probability distributions of a certain form, specified below. This special form is chosen for mathematical convenience, including the enabling of the user to calculate expectations, covariances using differentiation based on some useful algebraic properties, as well as for generality, as exponential families are in a sense very natural sets of distributions to consider. The term exponential class is sometimes used in place of "exponential family", or the older term Koopman–Darmois family. Sometimes loosely referred to as "the" exponential family, this class of distributions is distinct because they all possess a variety of desirable properties, most importantly the existence of a sufficient statistic.
In numerical analysis and computational statistics, rejection sampling is a basic technique used to generate observations from a distribution. It is also commonly called the acceptance-rejection method or "accept-reject algorithm" and is a type of exact simulation method. The method works for any distribution in with a density.
In statistics, Gibbs sampling or a Gibbs sampler is a Markov chain Monte Carlo (MCMC) algorithm for sampling from a specified multivariate probability distribution when direct sampling from the joint distribution is difficult, but sampling from the conditional distribution is more practical. This sequence can be used to approximate the joint distribution ; to approximate the marginal distribution of one of the variables, or some subset of the variables ; or to compute an integral. Typically, some of the variables correspond to observations whose values are known, and hence do not need to be sampled.
In statistics, a generalized linear model (GLM) is a flexible generalization of ordinary linear regression. The GLM generalizes linear regression by allowing the linear model to be related to the response variable via a link function and by allowing the magnitude of the variance of each measurement to be a function of its predicted value.
In Bayesian probability theory, if the posterior distribution is in the same probability distribution family as the prior probability distribution , the prior and posterior are then called conjugate distributions, and the prior is called a conjugate prior for the likelihood function .

Random forests or random decision forests is an ensemble learning method for classification, regression and other tasks that operates by constructing a multitude of decision trees at training time. For classification tasks, the output of the random forest is the class selected by most trees. For regression tasks, the mean or average prediction of the individual trees is returned. Random decision forests correct for decision trees' habit of overfitting to their training set.

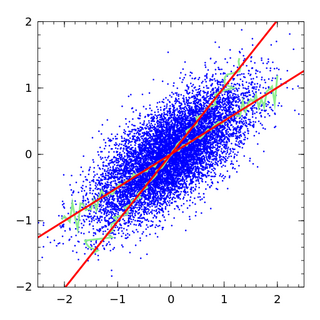
Regression dilution, also known as regression attenuation, is the biasing of the linear regression slope towards zero, caused by errors in the independent variable.
Conditional random fields (CRFs) are a class of statistical modeling methods often applied in pattern recognition and machine learning and used for structured prediction. Whereas a classifier predicts a label for a single sample without considering "neighbouring" samples, a CRF can take context into account. To do so, the predictions are modelled as a graphical model, which represents the presence of dependencies between the predictions. What kind of graph is used depends on the application. For example, in natural language processing, "linear chain" CRFs are popular, for which each prediction is dependent only on its immediate neighbours. In image processing, the graph typically connects locations to nearby and/or similar locations to enforce that they receive similar predictions.
Bootstrapping is any test or metric that uses random sampling with replacement, and falls under the broader class of resampling methods. Bootstrapping assigns measures of accuracy to sample estimates. This technique allows estimation of the sampling distribution of almost any statistic using random sampling methods.

In graph theory, a random geometric graph (RGG) is the mathematically simplest spatial network, namely an undirected graph constructed by randomly placing N nodes in some metric space and connecting two nodes by a link if and only if their distance is in a given range, e.g. smaller than a certain neighborhood radius, r.
In statistics, explained variation measures the proportion to which a mathematical model accounts for the variation (dispersion) of a given data set. Often, variation is quantified as variance; then, the more specific term explained variance can be used.

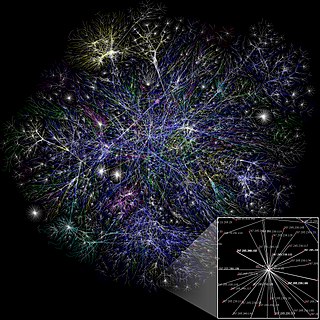
Network science is an academic field which studies complex networks such as telecommunication networks, computer networks, biological networks, cognitive and semantic networks, and social networks, considering distinct elements or actors represented by nodes and the connections between the elements or actors as links. The field draws on theories and methods including graph theory from mathematics, statistical mechanics from physics, data mining and information visualization from computer science, inferential modeling from statistics, and social structure from sociology. The United States National Research Council defines network science as "the study of network representations of physical, biological, and social phenomena leading to predictive models of these phenomena."
Graphical models have become powerful frameworks for protein structure prediction, protein–protein interaction, and free energy calculations for protein structures. Using a graphical model to represent the protein structure allows the solution of many problems including secondary structure prediction, protein-protein interactions, protein-drug interaction, and free energy calculations.
In probability and statistics, a compound probability distribution is the probability distribution that results from assuming that a random variable is distributed according to some parametrized distribution, with the parameters of that distribution themselves being random variables. If the parameter is a scale parameter, the resulting mixture is also called a scale mixture.

Exponential Random Graph Models (ERGMs) are a family of statistical models for analyzing data from social and other networks. Examples of networks examined using ERGM include knowledge networks, organizational networks, colleague networks, social media networks, networks of scientific development, and others.
In statistics, the variance function is a smooth function that depicts the variance of a random quantity as a function of its mean. The variance function is a measure of heteroscedasticity and plays a large role in many settings of statistical modelling. It is a main ingredient in the generalized linear model framework and a tool used in non-parametric regression, semiparametric regression and functional data analysis. In parametric modeling, variance functions take on a parametric form and explicitly describe the relationship between the variance and the mean of a random quantity. In a non-parametric setting, the variance function is assumed to be a smooth function.
Exponential Tilting (ET), Exponential Twisting, or Exponential Change of Measure (ECM) is a distribution shifting technique used in many parts of mathematics. The different exponential tiltings of a random variable is known as the natural exponential family of .


