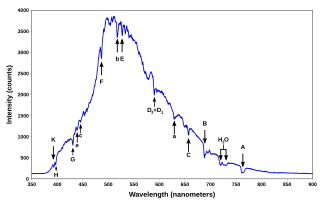
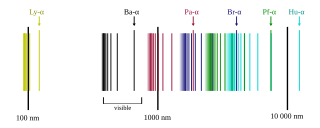
The "visible" hydrogen emission spectrum lines in the Balmer series. H-alpha is the red line at the right. Four lines (counting from the right) are formally in the visible range. Lines five and six can be seen with the naked eye, but are considered to be ultraviolet as they have wavelengths less than 400 nm.
The visible spectrum of light from hydrogen displays four wavelengths, 410nm, 434nm, 486nm, and 656nm, that correspond to emissions of photons by electrons in excited states transitioning to the quantum level described by the principal quantum numbern equals 2.[1] There are several prominent ultraviolet Balmer lines with wavelengths shorter than 400nm. The series continues with an infinite number of lines whose wavelengths asymptotically approach the limit of 364.5nm in the ultraviolet.
After Balmer's discovery, five other hydrogen spectral series were discovered, corresponding to electrons transitioning to values of n other than two .
Overview
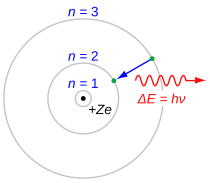
In the simplified Rutherford Bohr model of the hydrogen atom, the Balmer lines result from an electron jump between the second energy level closest to the nucleus, and those levels more distant. Shown here is a photon emission. The 3→2 transition depicted here produces H-alpha, the first line of the Balmer series. For hydrogen (Z=1) this transition results in a photon of wavelength 656nm (red).
The Balmer series is characterized by the electron transitioning from n≥3 to n=2, where n refers to the radial quantum number or principal quantum number of the electron. The transitions are named sequentially by Greek letter: n=3 to n=2 is called H-α, 4 to 2 is H-β, 5 to 2 is H-γ, and 6 to 2 is H-δ. As the first spectral lines associated with this series are located in the visible part of the electromagnetic spectrum, these lines are historically referred to as "H-alpha", "H-beta", "H-gamma", and so on, where H is the element hydrogen.
Although physicists were aware of atomic emissions before 1885, they lacked a tool to accurately predict where the spectral lines should appear. The Balmer equation predicts the four visible spectral lines of hydrogen with high accuracy. Balmer's equation inspired the Rydberg equation as a generalization of it, and this in turn led physicists to find the Lyman, Paschen, and Brackett series, which predicted other spectral lines of hydrogen found outside the visible spectrum.
The red H-alpha spectral line of the Balmer series of atomic hydrogen, which is the transition from the shell n=3 to the shell n=2, is one of the conspicuous colours of the universe. It contributes a bright red line to the spectra of emission or ionisation nebula, like the Orion Nebula, which are often H II regions found in star forming regions. In true-colour pictures, these nebula have a reddish-pink colour from the combination of visible Balmer lines that hydrogen emits.
Later, it was discovered that when the Balmer series lines of the hydrogen spectrum were examined at very high resolution, they were closely spaced doublets. This splitting is called fine structure. It was also found that excited electrons from shells with n greater than 6 could jump to the n=2 shell, emitting shades of ultraviolet when doing so.
Two of the Balmer lines (α and β) are clearly visible in this emission spectrum of a deuterium lamp
Balmer's formula
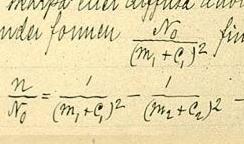
Balmer noticed that a single wavelength had a relation to every line in the hydrogen spectrum that was in the visible light region. That wavelength was 364.50682nm. When any integer higher than 2 was squared and then divided by itself squared minus 4, then that number multiplied by 364.50682nm (see equation below) gave the wavelength of another line in the hydrogen spectrum. By this formula, he was able to show that some measurements of lines made in his time by spectroscopy were slightly inaccurate, and his formula also predicted lines that had not yet been observed but were found later. His number also proved to be the limit of the series. The Balmer equation could be used to find the wavelength of the absorption/emission lines and was originally presented as follows (save for a notation change to give Balmer's constant as B):
Where
λ is the wavelength.
B is a constant with the value of 3.6450682×10⁻⁷m or 364.50682nm.
m is the initial state (m∈ℕ, m≥1).
n is the final state (n∈ℕ, n>m).
In 1888 the physicist Johannes Rydberg generalized the Balmer equation for all transitions of hydrogen. The equation commonly used to calculate the Balmer series is a specific example of the Rydberg formula and follows as a simple reciprocal mathematical rearrangement of the formula above (conventionally using a notation of m for n as the single integral constant needed):
where λ is the wavelength of the absorbed/emitted light and RH is the Rydberg constant for hydrogen. The Rydberg constant is seen to be equal to 4/B in Balmer's formula, and this value, for an infinitely heavy nucleus, is 4/3.6450682×10−7m= 10973731.57m−1.[3]
Role in astronomy
The Balmer series is particularly useful in astronomy because the Balmer lines appear in numerous stellar objects due to the abundance of hydrogen in the universe, and therefore are commonly seen and relatively strong compared to lines from other elements.
The spectral classification of stars, which is primarily a determination of surface temperature, is based on the relative strength of spectral lines, and the Balmer series in particular is very important. Other characteristics of a star that can be determined by close analysis of its spectrum include surface gravity (related to physical size) and composition.
Because the Balmer lines are commonly seen in the spectra of various objects, they are often used to determine radial velocities due to doppler shifting of the Balmer lines. This has important uses all over astronomy, from detecting binary stars, exoplanets, compact objects such as neutron stars and black holes (by the motion of hydrogen in accretion disks around them), identifying groups of objects with similar motions and presumably origins (moving groups, star clusters, galaxy clusters, and debris from collisions), determining distances (actually redshifts) of galaxies or quasars, and identifying unfamiliar objects by analysis of their spectrum.
Balmer lines can appear as absorption or emission lines in a spectrum, depending on the nature of the object observed. In stars, the Balmer lines are usually seen in absorption, and they are "strongest" in stars with a surface temperature of about 10,000 kelvins (spectral type A). In the spectra of most spiral and irregular galaxies, active galactic nuclei, H II regions and planetarynebulae, the Balmer lines are emission lines.
In stellar spectra, the H-epsilon line (transition 7→2, 397.007nm) is often mixed in with another absorption line caused by ionized calcium known as "H" (the original designation given by Joseph von Fraunhofer). H-epsilon is separated by 0.16nm from Ca II H at 396.847nm, and cannot be resolved in low-resolution spectra. The H-zeta line (transition 8→2) is similarly mixed in with a neutral helium line seen in hot stars.
1 2 3 4 5 6 7 Kramida, A., Ralchenko, Yu., Reader, J., and NIST ASD Team (2019). NIST Atomic Spectra Database (ver. 5.7.1), [Online]. Available: https://physics.nist.gov/asd [2020, April 11]. National Institute of Standards and Technology, Gaithersburg, MD. DOI: https://doi.org/10.18434/T4W30F
In atomic physics, the Bohr model or Rutherford–Bohr model is an obsolete model of the atom, presented by Niels Bohr and Ernest Rutherford in 1913. It consists of a small, dense nucleus surrounded by orbiting electrons. It is analogous to the structure of the Solar System, but with attraction provided by electrostatic force rather than gravity, and with the electron energies quantized.
In physics, Wien's displacement law states that the black-body radiation curve for different temperatures will peak at different wavelengths that are inversely proportional to the temperature. The shift of that peak is a direct consequence of the Planck radiation law, which describes the spectral brightness or intensity of black-body radiation as a function of wavelength at any given temperature. However, it had been discovered by German physicist Wilhelm Wien several years before Max Planck developed that more general equation, and describes the entire shift of the spectrum of black-body radiation toward shorter wavelengths as temperature increases.
A quantum mechanical system or particle that is bound—that is, confined spatially—can only take on certain discrete values of energy, called energy levels. This contrasts with classical particles, which can have any amount of energy. The term is commonly used for the energy levels of the electrons in atoms, ions, or molecules, which are bound by the electric field of the nucleus, but can also refer to energy levels of nuclei or vibrational or rotational energy levels in molecules. The energy spectrum of a system with such discrete energy levels is said to be quantized.
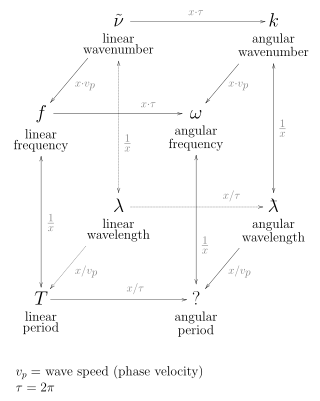
In the physical sciences, the wavenumber, also known as repetency, is the spatial frequency of a wave, measured in cycles per unit distance or radians per unit distance. It is analogous to temporal frequency, which is defined as the number of wave cycles per unit time or radians per unit time.
The Bohr radius is a physical constant, approximately equal to the most probable distance between the nucleus and the electron in a hydrogen atom in its ground state. It is named after Niels Bohr, due to its role in the Bohr model of an atom. Its value is 5.29177210903(80)×10−11 m.
A spectral line is a weaker or stronger region in an otherwise uniform and continuous spectrum. It may result from emission or absorption of light in a narrow frequency range, compared with the nearby frequencies. Spectral lines are often used to identify atoms and molecules. These "fingerprints" can be compared to the previously collected ones of atoms and molecules, and are thus used to identify the atomic and molecular components of stars and planets, which would otherwise be impossible.
In spectroscopy, the Rydberg constant, symbol for heavy atoms or for hydrogen, named after the Swedish physicist Johannes Rydberg, is a physical constant relating to the electromagnetic spectra of an atom. The constant first arose as an empirical fitting parameter in the Rydberg formula for the hydrogen spectral series, but Niels Bohr later showed that its value could be calculated from more fundamental constants according to his model of the atom.
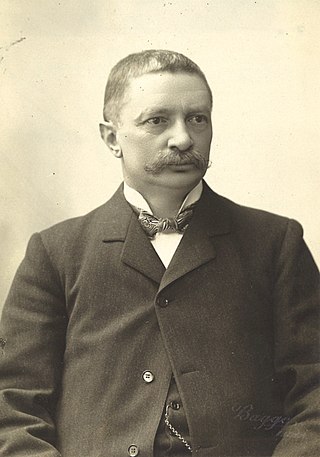
Johannes (Janne) Robert Rydberg was a Swedish physicist mainly known for devising the Rydberg formula, in 1888, which is used to describe the wavelengths of photons emitted by changes in the energy level of an electron in a hydrogen atom.
In atomic physics, the Rydberg formula calculates the wavelengths of a spectral line in many chemical elements. The formula was primarily presented as a generalization of the Balmer series for all atomic electron transitions of hydrogen. It was first empirically stated in 1888 by the Swedish physicist Johannes Rydberg, then theoretically by Niels Bohr in 1913, who used a primitive form of quantum mechanics. The formula directly generalizes the equations used to calculate the wavelengths of the hydrogen spectral series.
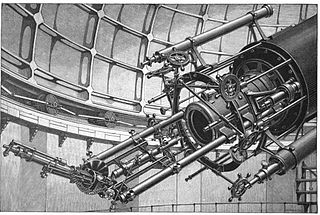
Astronomical spectroscopy is the study of astronomy using the techniques of spectroscopy to measure the spectrum of electromagnetic radiation, including visible light, ultraviolet, X-ray, infrared and radio waves that radiate from stars and other celestial objects. A stellar spectrum can reveal many properties of stars, such as their chemical composition, temperature, density, mass, distance and luminosity. Spectroscopy can show the velocity of motion towards or away from the observer by measuring the Doppler shift. Spectroscopy is also used to study the physical properties of many other types of celestial objects such as planets, nebulae, galaxies, and active galactic nuclei.
The emission spectrum of a chemical element or chemical compound is the spectrum of frequencies of electromagnetic radiation emitted due to electrons making a transition from a high energy state to a lower energy state. The photon energy of the emitted photons is equal to the energy difference between the two states. There are many possible electron transitions for each atom, and each transition has a specific energy difference. This collection of different transitions, leading to different radiated wavelengths, make up an emission spectrum. Each element's emission spectrum is unique. Therefore, spectroscopy can be used to identify elements in matter of unknown composition. Similarly, the emission spectra of molecules can be used in chemical analysis of substances.
Hydrogen-alpha, typically shortened to H-alpha or Hα, is a deep-red visible spectral line of the hydrogen atom with a wavelength of 656.28 nm in air and 656.46 nm in vacuum. It is the first spectral line in the Balmer series and is emitted when an electron falls from a hydrogen atom's third- to second-lowest energy level. H-alpha has applications in astronomy where its emission can be observed from emission nebulae and from features in the Sun's atmosphere, including solar prominences and the chromosphere.
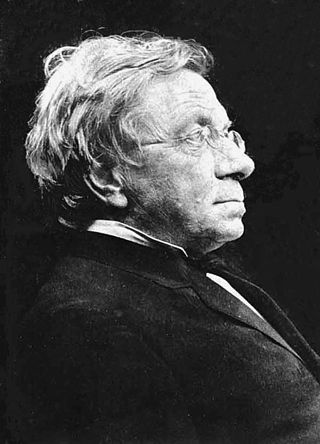
In physics and chemistry, the Lyman series is a hydrogen spectral series of transitions and resulting ultraviolet emission lines of the hydrogen atom as an electron goes from n ≥ 2 to n = 1, the lowest energy level of the electron. The transitions are named sequentially by Greek letters: from n = 2 to n = 1 is called Lyman-alpha, 3 to 1 is Lyman-beta, 4 to 1 is Lyman-gamma, and so on. The series is named after its discoverer, Theodore Lyman. The greater the difference in the principal quantum numbers, the higher the energy of the electromagnetic emission.
Johann Jakob Balmer was a Swiss mathematician best known for his work in physics, the Balmer series of hydrogen atom.
The emission spectrum of atomic hydrogen has been divided into a number of spectral series, with wavelengths given by the Rydberg formula. These observed spectral lines are due to the electron making transitions between two energy levels in an atom. The classification of the series by the Rydberg formula was important in the development of quantum mechanics. The spectral series are important in astronomical spectroscopy for detecting the presence of hydrogen and calculating red shifts.
The Rydberg–Ritz combination principle is an empirical rule proposed by Walther Ritz in 1908 to describe the relationship of the spectral lines for all atoms, as a generalization of an earlier rule by Johannes Rydberg for the hydrogen atom and the alkali metals. The principle states that the spectral lines of any element include frequencies that are either the sum or the difference of the frequencies of two other lines. Lines of the spectra of elements could be predicted from existing lines. Since the frequency of light is proportional to the wavenumber or reciprocal wavelength, the principle can also be expressed in terms of wavenumbers which are the sum or difference of wavenumbers of two other lines.
The history of quantum mechanics is a fundamental part of the history of modern physics. The major chapters of this history begin with the emergence of quantum ideas to explain individual phenomena—blackbody radiation, the photoelectric effect, solar emission spectra—an era called the Old or Older quantum theories. Building on the technology developed in classical mechanics, the invention of wave mechanics by Erwin Schrödinger and expansion by many others triggers the "modern" era beginning around 1925. Paul Dirac's relativistic quantum theory work lead him to explore quantum theories of radiation, culminating in quantum electrodynamics, the first quantum field theory. The history of quantum mechanics continues in the history of quantum field theory. The history of quantum chemistry, theoretical basis of chemical structure, reactivity, and bonding, interlaces with the events discussed in this article.
The Pickering series (also known as the Pickering–Fowler series) consists of three lines of singly ionised helium found, usually in absorption, in the spectra of hot stars like Wolf–Rayet stars. The name comes from Edward Charles Pickering and Alfred Fowler. The lines are produced by transitions from a higher energy level of an electron to a level with principal quantum number n = 4. The lines have wavelengths:
The sharp series is a series of spectral lines in the atomic emission spectrum caused when electrons descend from higher-energy s orbitals of an atom to the lowest available p orbital. The spectral lines include some in the visible light, and they extend into the ultraviolet. The lines get closer and closer together as the frequency increases never exceeding the series limit. The sharp series was important in the development of the understanding of electron shells and subshells in atoms. The sharp series has given the letter s to the s atomic orbital or subshell.
The diffuse series is a series of spectral lines in the atomic emission spectrum caused when electrons jump between the lowest p orbital and d orbitals of an atom. The total orbital angular momentum changes between 1 and 2. The spectral lines include some in the visible light, and may extend into ultraviolet or near infrared. The lines get closer and closer together as the frequency increases never exceeding the series limit. The diffuse series was important in the development of the understanding of electron shells and subshells in atoms. The diffuse series has given the letter d to the d atomic orbital or subshell.
This page is based on this Wikipedia article Text is available under the CC BY-SA 4.0 license; additional terms may apply. Images, videos and audio are available under their respective licenses.