Related Research Articles
Fundamental analysis, in accounting and finance, is the analysis of a business's financial statements ; health; and competitors and markets. It also considers the overall state of the economy and factors including interest rates, production, earnings, employment, GDP, housing, manufacturing and management. There are two basic approaches that can be used: bottom up analysis and top down analysis. These terms are used to distinguish such analysis from other types of investment analysis, such as quantitative and technical.

The Dow Jones Industrial Average (DJIA), Dow Jones, or simply the Dow, is a stock market index of 30 prominent companies listed on stock exchanges in the United States.

A stock market, equity market, or share market is the aggregation of buyers and sellers of stocks, which represent ownership claims on businesses; these may include securities listed on a public stock exchange as well as stock that is only traded privately, such as shares of private companies that are sold to investors through equity crowdfunding platforms. Investments are usually made with an investment strategy in mind.

In finance, discounting is a mechanism in which a debtor obtains the right to delay payments to a creditor, for a defined period of time, in exchange for a charge or fee. Essentially, the party that owes money in the present purchases the right to delay the payment until some future date. This transaction is based on the fact that most people prefer current interest to delayed interest because of mortality effects, impatience effects, and salience effects. The discount, or charge, is the difference between the original amount owed in the present and the amount that has to be paid in the future to settle the debt.

A stock market crash is a sudden dramatic decline of stock prices across a major cross-section of a stock market, resulting in a significant loss of paper wealth. Crashes are driven by panic selling and underlying economic factors. They often follow speculation and economic bubbles.
A market trend is a perceived tendency of the financial markets to move in a particular direction over time. Analysts classify these trends as secular for long time-frames, primary for medium time-frames, and secondary for short time-frames. Traders attempt to identify market trends using technical analysis, a framework which characterizes market trends as predictable price tendencies within the market when price reaches support and resistance levels, varying over time.
Investment is traditionally defined as the "commitment of resources to achieve later benefits". If an investment involves money, then it can be defined as a "commitment of money to receive more money later". From a broader viewpoint, an investment can be defined as "to tailor the pattern of expenditure and receipt of resources to optimise the desirable patterns of these flows". When expenditures and receipts are defined in terms of money, then the net monetary receipt in a time period is termed cash flow, while money received in a series of several time periods is termed cash flow stream.
An economic bubble is a period when current asset prices greatly exceed their intrinsic valuation, being the valuation that the underlying long-term fundamentals justify. Bubbles can be caused by overly optimistic projections about the scale and sustainability of growth, and/or by the belief that intrinsic valuation is no longer relevant when making an investment. They have appeared in most asset classes, including equities, commodities, real estate, and even esoteric assets. Bubbles usually form as a result of either excess liquidity in markets, and/or changed investor psychology. Large multi-asset bubbles, are attributed to central banking liquidity.

The Wall Street Crash of 1929, also known as the Great Crash or the Crash of '29, was a major American stock market crash that occurred in the autumn of 1929. It started in September, when share prices on the New York Stock Exchange (NYSE) collapsed, and ended in mid-November. The pivotal role of the 1920s' high-flying bull market and the subsequent catastrophic collapse of the NYSE in late 1929 is often highlighted in explanations of the causes of the worldwide Great Depression.
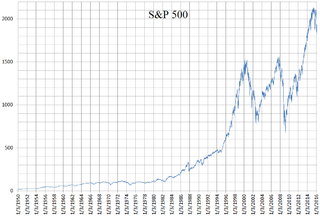
The Standard and Poor's 500, or simply the S&P 500, is a stock market index tracking the stock performance of 500 of the largest companies listed on stock exchanges in the United States. It is one of the most commonly followed equity indices. As of December 31, 2021, according to surveys, more than $7.1 trillion was invested in assets tied to the performance of the index.
The dividend yield or dividend–price ratio of a share is the dividend per share divided by the price per share. It is also a company's total annual dividend payments divided by its market capitalization, assuming the number of shares is constant. It is often expressed as a percentage.
In financial markets, stock valuation is the method of calculating theoretical values of companies and their stocks. The main use of these methods is to predict future market prices, or more generally, potential market prices, and thus to profit from price movement – stocks that are judged undervalued are bought, while stocks that are judged overvalued are sold, in the expectation that undervalued stocks will overall rise in value, while overvalued stocks will generally decrease in value. A target price is a price at which an analyst believes a stock to be fairly valued relative to its projected and historical earnings.

The Panic of 1857 was a financial crisis in the United States caused by the declining international economy and over-expansion of the domestic economy. Because of the invention of the telegraph by Samuel F. Morse in 1844, the Panic of 1857 was the first financial crisis to spread rapidly throughout the United States. The world economy was more interconnected by the 1850s, which made the Panic of 1857 the first worldwide economic crisis. In Britain, the Palmerston government circumvented the requirements of the Bank Charter Act 1844, which required gold and silver reserves to back up the amount of money in circulation. Surfacing news of this circumvention set off the Panic in Britain.

Value investing is an investment paradigm that involves buying securities that appear underpriced by some form of fundamental analysis. The various forms of value investing derive from the investment philosophy first taught by Benjamin Graham and David Dodd at Columbia Business School in 1928, and subsequently developed in their 1934 text Security Analysis.
Contrarian investing is an investment strategy that is characterized by purchasing and selling in contrast to the prevailing sentiment of the time.
Market timing is the strategy of making buying or selling decisions of financial assets by attempting to predict future market price movements. The prediction may be based on an outlook of market or economic conditions resulting from technical or fundamental analysis. This is an investment strategy based on the outlook for an aggregate market rather than for a particular financial asset.
A financial crisis is any of a broad variety of situations in which some financial assets suddenly lose a large part of their nominal value. In the 19th and early 20th centuries, many financial crises were associated with banking panics, and many recessions coincided with these panics. Other situations that are often called financial crises include stock market crashes and the bursting of other financial bubbles, currency crises, and sovereign defaults. Financial crises directly result in a loss of paper wealth but do not necessarily result in significant changes in the real economy.
In finance, relative value is the attractiveness measured in terms of risk, liquidity, and return of one financial instrument relative to another, or for a given instrument, of one maturity relative to another. The concept arises in economics, business and investment.
See Business Cycle.
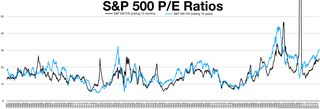
The cyclically adjusted price-to-earnings ratio, commonly known as CAPE, Shiller P/E, or P/E 10 ratio, is a valuation measure usually applied to the US S&P 500 equity market. It is defined as price divided by the average of ten years of earnings, adjusted for inflation. As such, it is principally used to assess likely future returns from equities over timescales of 10 to 20 years, with higher than average CAPE values implying lower than average long-term annual average returns.
References
- ↑ Benner, Samuel (29 June 2008). Benner's Prophecies of Future Ups and Downs in Prices: What Years to Make Money on Pig-Iron, Hogs, Corn, and Provisions (1884). Kessinger Publishing. ISBN 143678736X.
- ↑ Constance Brown (2010). Fibonacci Analysis. Wiley. p. 101. ISBN 9780470883242.
- ↑ Protonotarios, Giorgos. "The Cyclicality of Financial Markets and Benner's Cycle". TradingCenter.