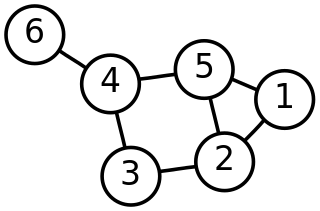
In mathematics, graph theory is the study of graphs, which are mathematical structures used to model pairwise relations between objects. A graph in this context is made up of vertices which are connected by edges. A distinction is made between undirected graphs, where edges link two vertices symmetrically, and directed graphs, where edges link two vertices asymmetrically. Graphs are one of the principal objects of study in discrete mathematics.

Graph drawing is an area of mathematics and computer science combining methods from geometric graph theory and information visualization to derive two-dimensional depictions of graphs arising from applications such as social network analysis, cartography, linguistics, and bioinformatics.
DOT is a graph description language, developed as a part of the Graphviz project. DOT graphs are typically stored as files with the .gv or .dot filename extension — .gv is preferred, to avoid confusion with the .dot extension used by versions of Microsoft Word before 2007. dot is also the name of the main program to process DOT files in the Graphviz package.
Force-directed graph drawing algorithms are a class of algorithms for drawing graphs in an aesthetically-pleasing way. Their purpose is to position the nodes of a graph in two-dimensional or three-dimensional space so that all the edges are of more or less equal length and there are as few crossing edges as possible, by assigning forces among the set of edges and the set of nodes, based on their relative positions, and then using these forces either to simulate the motion of the edges and nodes or to minimize their energy.
Graph Modeling Language (GML) is a hierarchical ASCII-based file format for describing graphs. It has been also named Graph Meta Language.
A phylogenetic network is any graph used to visualize evolutionary relationships between nucleotide sequences, genes, chromosomes, genomes, or species. They are employed when reticulation events such as hybridization, horizontal gene transfer, recombination, or gene duplication and loss are believed to be involved. They differ from phylogenetic trees by the explicit modeling of richly linked networks, by means of the addition of hybrid nodes instead of only tree nodes. Phylogenetic trees are a subset of phylogenetic networks. Phylogenetic networks can be inferred and visualised with software such as SplitsTree, the R-package, phangorn, and, more recently, Dendroscope. A standard format for representing phylogenetic networks is a variant of Newick format which is extended to support networks as well as trees.
A bigraph can be modelled as the superposition of a graph and a set of trees.
XGMML is an XML application based on GML which is used for graph description.
Cytoscape is an open source bioinformatics software platform for visualizing molecular interaction networks and integrating with gene expression profiles and other state data. Additional features are available as plugins. Plugins are available for network and molecular profiling analyses, new layouts, additional file format support and connection with databases and searching in large networks. Plugins may be developed using the Cytoscape open Java software architecture by anyone and plugin community development is encouraged. Cytoscape also has a JavaScript-centric sister project named Cytoscape.js that can be used to analyse and visualise graphs in JavaScript environments, like a browser.

The International Symposium on Graph Drawing (GD) is an annual academic conference in which researchers present peer reviewed papers on graph drawing, information visualization of network information, geometric graph theory, and related topics.

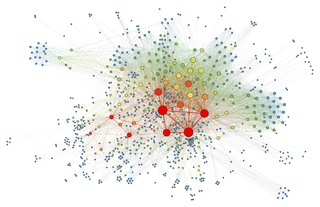
Network science is an academic field which studies complex networks such as telecommunication networks, computer networks, biological networks, cognitive and semantic networks, and social networks, considering distinct elements or actors represented by nodes and the connections between the elements or actors as links. The field draws on theories and methods including graph theory from mathematics, statistical mechanics from physics, data mining and information visualization from computer science, inferential modeling from statistics, and social structure from sociology. The United States National Research Council defines network science as "the study of network representations of physical, biological, and social phenomena leading to predictive models of these phenomena."
The clique percolation method is a popular approach for analyzing the overlapping community structure of networks. The term network community has no widely accepted unique definition and it is usually defined as a group of nodes that are more densely connected to each other than to other nodes in the network. There are numerous alternative methods for detecting communities in networks, for example, the Girvan–Newman algorithm, hierarchical clustering and modularity maximization.

NetworkX is a Python library for studying graphs and networks. NetworkX is free software released under the BSD-new license.

Layered graph drawing or hierarchical graph drawing is a type of graph drawing in which the vertices of a directed graph are drawn in horizontal rows or layers with the edges generally directed downwards. It is also known as Sugiyama-style graph drawing after Kozo Sugiyama, who first developed this drawing style.

Gephi is an open-source network analysis and visualization software package written in Java on the NetBeans platform.

An arc diagram is a style of graph drawing, in which the vertices of a graph are placed along a line in the Euclidean plane, with edges being drawn as semicircles in one or both of the two halfplanes bounded by the line, or as smooth curves formed by sequences of semicircles. In some cases, line segments of the line itself are also allowed as edges, as long as they connect only vertices that are consecutive along the line. Variations of this drawing style in which the semicircles are replaced by convex curves of some other type are also commonly called arc diagrams.
NodeXL is a network analysis and visualization software package for Microsoft Excel 2007/2010/2013/2016. The package is similar to other network visualization tools such as Pajek, UCINet, and Gephi. It is widely applied in ring, mapping of vertex and edge, and customizable visual attributes and tags. NodeXL enables researchers to undertake social network analysis work metrics such as centrality, degree, and clustering, as well as monitor relational data and describe the overall relational network structure. When applied to Twitter data analysis, it showed the total network of all users participating in public discussion and its internal structure through data mining. It allows social Network analysis (SNA) to emphasize the relationships rather than the isolated individuals or organizations, allowing interested parties to investigate the two-way dialogue between organizations and the public. SNA also provides a flexible measurement system and parameter selection to confirm the influential nodes in the network, such as in-degree and out-degree centrality. The software contains network visualization, social network analysis features, access to social media network data importers, advanced network metrics, and automation.
A hyperbolic geometric graph (HGG) or hyperbolic geometric network (HGN) is a special type of spatial network where (1) latent coordinates of nodes are sprinkled according to a probability density function into a hyperbolic space of constant negative curvature and (2) an edge between two nodes is present if they are close according to a function of the metric (typically either a Heaviside step function resulting in deterministic connections between vertices closer than a certain threshold distance, or a decaying function of hyperbolic distance yielding the connection probability). A HGG generalizes a random geometric graph (RGG) whose embedding space is Euclidean.
In network theory, multidimensional networks, a special type of multilayer network, are networks with multiple kinds of relations. Increasingly sophisticated attempts to model real-world systems as multidimensional networks have yielded valuable insight in the fields of social network analysis, economics, urban and international transport, ecology, psychology, medicine, biology, commerce, climatology, physics, computational neuroscience, operations management, and finance.

Security visualisation is a subject that broadly covers aspects of big data, visualisation, human perception and security. Each day, we are collecting more and more data in the form of log files and it is often meaningless if the data is not analyzed thoroughly. Big data mining techniques like Map Reduce help narrow down the search for meaning in vast data. Data visualisation is a data analytics technique, which is used to engage the human brain into finding patterns in data.