Birmingham Yardley | |
---|---|
Borough constituency for the House of Commons | |
![]() | |
![]() Boundary of Birmingham Yardley in West Midlands region | |
County | West Midlands |
Population | 106,738 (2011 census) [1] |
Electorate | 73,261 (December 2010) [2] |
Current constituency | |
Created | 1918 |
Member of Parliament | Jess Phillips (Labour) |
Seats | One |
Created from | Birmingham East and Tamworth |
Birmingham Yardley is a constituency [n 1] of part of the city of Birmingham represented in the House of Commons of the UK Parliament since 2015 by Jess Phillips of the Labour Party. [n 2]
Yardley Rural District was annexed to Birmingham under the 1911 Greater Birmingham Act.
The seat covers south-eastern areas of Birmingham including Stechford, Tyseley, Yardley and Acocks Green. Electoral Calculus describes the seat as "Centrist", characterised by moderate views on social and economic issues. [3]
1918–1950: The County Borough of Birmingham wards of Saltley, Small Heath, and Yardley.
1950–1955: The County Borough of Birmingham wards of Acocks Green, and Yardley. [4]
1955–1983: The County Borough of Birmingham wards of Acocks Green, Sheldon, and Yardley. [5]
1983–2010: The City of Birmingham wards of Acocks Green, Sheldon, and Yardley.
2010–2024: The City of Birmingham wards of Acocks Green, Sheldon, South Yardley, and Stechford and Yardley North.
2024–present: The City of Birmingham wards of Acocks Green; Sheldon; Small Heath; South Yardley; Tyseley & Hay Mills; Yardley East; Yardley West & Stechford. [6]
From the seat's creation in 1918 until the 2005 general election, the MP elected for Birmingham Yardley was on all but three occasions a member of the party that won the general election, making it a former bellwether seat. Exceptions were Labour wins in the constituency compared to Conservative wins nationally in 1951, 1955 and 1992.
Party | Candidate | Votes | % | ±% | |
---|---|---|---|---|---|
Conservative | Yvonne Clements | ||||
Green | Roxanne Green | ||||
Liberal Democrats | Roger Harmer | ||||
Reform UK | Nora Kamberi | ||||
Workers Party | Jody McIntyre | ||||
Labour | Jess Phillips | ||||
Majority | |||||
Turnout | |||||
Swing | |||||
Party | Candidate | Votes | % | ±% | |
---|---|---|---|---|---|
Labour | Jess Phillips | 23,379 | 54.8 | ![]() | |
Conservative | Vincent Garrington | 12,720 | 29.8 | ![]() | |
Liberal Democrats | Roger Harmer | 3,754 | 8.8 | ![]() | |
Brexit Party | Mary McKenna | 2,246 | 5.3 | New | |
Green | Christopher Garghan | 579 | 1.4 | ![]() | |
Majority | 10,659 | 25.0 | ![]() | ||
Turnout | 42,678 | 57.3 | ![]() | ||
Labour hold | Swing | ![]() | |||
Party | Candidate | Votes | % | ±% | |
---|---|---|---|---|---|
Labour | Jess Phillips | 25,398 | 57.1 | ![]() | |
Conservative | Mohammed Afzal | 8,824 | 19.8 | ![]() | |
Liberal Democrats | John Hemming | 7,984 | 17.9 | ![]() | |
UKIP | Paul Clayton | 1,916 | 4.3 | ![]() | |
Green | Christopher Garghan | 280 | 0.6 | ![]() | |
Independent | Abu Nowshed | 100 | 0.2 | New | |
Majority | 16,574 | 37.3 | ![]() | ||
Turnout | 44,502 | 61.3 | ![]() | ||
Labour hold | Swing | ![]() | |||
Party | Candidate | Votes | % | ±% | |
---|---|---|---|---|---|
Labour | Jess Phillips | 17,129 | 41.5 | ![]() | |
Liberal Democrats | John Hemming | 10,534 | 25.6 | ![]() | |
UKIP | Paul Clayton | 6,637 | 16.1 | ![]() | |
Conservative | Arun Photay | 5,760 | 14.0 | ![]() | |
Green | Grant Bishop | 698 | 1.7 | New | |
Respect | Teval Stephens | 187 | 0.5 | New | |
TUSC | Eamonn Flynn | 135 | 0.3 | New | |
SDP | Peter Johnson | 71 | 0.2 | New | |
Majority | 6,595 | 15.9 | N/A | ||
Turnout | 41,313 | 57.3 | ![]() | ||
Labour gain from Liberal Democrats | Swing | ![]() | |||
Party | Candidate | Votes | % | ±% | |
---|---|---|---|---|---|
Liberal Democrats | John Hemming | 16,162 | 39.6 | ![]() | |
Labour | Lynnette Kelly | 13,160 | 32.2 | ![]() | |
Conservative | Meirion Jenkins | 7,836 | 19.2 | ![]() | |
BNP | Tanya Lumby | 2,153 | 5.3 | ![]() | |
UKIP | Graham Duffen | 1,190 | 2.9 | ![]() | |
National Front | Paul Morris | 349 | 0.9 | ![]() | |
Majority | 3,002 | 7.4 | |||
Turnout | 40,850 | 56.5 | ![]() | ||
Liberal Democrats hold | Swing | ||||
Party | Candidate | Votes | % | ±% | |
---|---|---|---|---|---|
Liberal Democrats | John Hemming | 13,648 | 46.4 | ![]() | |
Labour | Jayne Innes | 10,976 | 37.3 | ![]() | |
Conservative | Paul Uppal | 2,970 | 10.1 | ![]() | |
BNP | Robert Purcell | 1,523 | 5.2 | New | |
UKIP | Mohammed Yaqub | 314 | 1.1 | ![]() | |
Majority | 2,672 | 9.1 | N/A | ||
Turnout | 29,431 | 57.7 | ![]() | ||
Liberal Democrats gain from Labour | Swing | ![]() | |||
Party | Candidate | Votes | % | ±% | |
---|---|---|---|---|---|
Labour | Estelle Morris | 14,085 | 46.9 | ![]() | |
Liberal Democrats | John Hemming | 11,507 | 38.3 | ![]() | |
Conservative | Barrie Roberts | 3,941 | 13.1 | ![]() | |
UKIP | Alan Ware | 329 | 1.1 | ![]() | |
Socialist Labour | Colin Wren | 151 | 0.5 | New | |
Majority | 2,578 | 8.6 | ![]() | ||
Turnout | 30,011 | 57.2 | ![]() | ||
Labour hold | Swing | ||||
Party | Candidate | Votes | % | ±% | |
---|---|---|---|---|---|
Labour | Estelle Morris | 17,778 | 47.0 | ![]() | |
Liberal Democrats | John Hemming | 12,463 | 33.0 | ![]() | |
Conservative | Anne Jobson | 6,736 | 17.8 | ![]() | |
Referendum | Duncan Livingston | 646 | 1.7 | New | |
UKIP | Alan Ware | 164 | 0.4 | New | |
Majority | 5,315 | 14.0 | ![]() | ||
Turnout | 37,787 | 71.2 | ![]() | ||
Labour hold | Swing | ||||
Party | Candidate | Votes | % | ±% | |
---|---|---|---|---|---|
Labour | Estelle Morris | 14,884 | 34.9 | ![]() | |
Conservative | David Bevan | 14,722 | 34.5 | ![]() | |
Liberal Democrats | John Hemming | 12,899 | 30.2 | ![]() | |
National Front | Pauline Read | 192 | 0.4 | New | |
Majority | 162 | 0.4 | N/A | ||
Turnout | 42,697 | 78.0 | ![]() | ||
Labour gain from Conservative | Swing | ![]() | |||
Party | Candidate | Votes | % | ±% | |
---|---|---|---|---|---|
Conservative | David Bevan | 17,931 | 42.6 | ![]() | |
Labour | Geoff Edge | 15,409 | 36.6 | ![]() | |
Liberal | Leslie Smith | 8,734 | 20.8 | ![]() | |
Majority | 2,522 | 6.0 | ![]() | ||
Turnout | 42,074 | 73.9 | ![]() | ||
Conservative hold | Swing | ||||
Party | Candidate | Votes | % | ±% | |
---|---|---|---|---|---|
Conservative | David Bevan | 17,986 | 43.2 | ![]() | |
Labour | Roger Godsiff | 15,121 | 36.3 | ![]() | |
SDP | David Bennett | 8,109 | 19.5 | ![]() | |
National Front | Robert Jones | 415 | 1.0 | ![]() | |
Majority | 2,865 | 6.9 | ![]() | ||
Turnout | 41,631 | 72.1 | ![]() | ||
Conservative hold | Swing | ||||
Party | Candidate | Votes | % | ±% | |
---|---|---|---|---|---|
Conservative | David Bevan | 20,193 | 47.56 | ||
Labour | Syd Tierney | 19,029 | 44.81 | ||
Liberal | Susan Mary Anderson | 2,491 | 5.87 | ||
National Front | Harold Challendar | 749 | 1.80 | ||
Majority | 1,164 | 2.75 | N/A | ||
Turnout | 42,462 | 73.75 | |||
Conservative gain from Labour | Swing | ||||
Party | Candidate | Votes | % | ±% | |
---|---|---|---|---|---|
Labour | Syd Tierney | 20,834 | 48.27 | ||
Conservative | Derek Coombs | 16,664 | 38.61 | ||
Liberal | John Aldridge | 4,518 | 10.47 | ||
National Front | Harold Challendar | 1,034 | 2.40 | New | |
More Prosperous Britain | Thomas Keen | 111 | 0.26 | New | |
Majority | 4,170 | 9.66 | |||
Turnout | 43,161 | 73.09 | |||
Labour hold | Swing | ||||
Party | Candidate | Votes | % | ±% | |
---|---|---|---|---|---|
Labour | Syd Tierney | 20,580 | 44.62 | ||
Conservative | Derek Coombs | 18,633 | 40.40 | ||
Liberal | John Aldridge | 6,912 | 14.99 | New | |
Majority | 1,947 | 4.22 | N/A | ||
Turnout | 39,213 | 78.72 | |||
Labour gain from Conservative | Swing | ||||
Party | Candidate | Votes | % | ±% | |
---|---|---|---|---|---|
Conservative | Derek Coombs | 21,827 | 50.14 | ||
Labour Co-op | Ioan Evans | 21,707 | 49.86 | ||
Majority | 120 | 0.28 | N/A | ||
Turnout | 43,534 | 69.70 | |||
Conservative gain from Labour | Swing | ||||
Party | Candidate | Votes | % | ±% | |
---|---|---|---|---|---|
Labour Co-op | Ioan Evans | 25,568 | 56.35 | ||
Conservative | Leonard Cleaver | 19,809 | 43.65 | ||
Majority | 5,759 | 12.70 | |||
Turnout | 45,377 | 77.62 | |||
Labour hold | Swing | ||||
Party | Candidate | Votes | % | ±% | |
---|---|---|---|---|---|
Labour Co-op | Ioan Evans | 22,788 | 50.19 | ||
Conservative | Leonard Cleaver | 22,619 | 49.81 | ||
Majority | 169 | 0.38 | N/A | ||
Turnout | 45,407 | 77.05 | |||
Labour gain from Conservative | Swing | ||||
Party | Candidate | Votes | % | ±% | |
---|---|---|---|---|---|
Conservative | Leonard Cleaver | 23,482 | 51.52 | ||
Labour | Henry Usborne | 22,097 | 48.48 | ||
Majority | 1,385 | 3.04 | N/A | ||
Turnout | 45,579 | 77.08 | |||
Conservative gain from Labour | Swing | ||||
Party | Candidate | Votes | % | ±% | |
---|---|---|---|---|---|
Labour | Henry Usborne | 23,722 | 53.52 | ||
Conservative | Philip Holland | 20,598 | 46.48 | ||
Majority | 3,124 | 7.04 | |||
Turnout | 44,320 | 75.02 | |||
Labour hold | Swing | ||||
Party | Candidate | Votes | % | ±% | |
---|---|---|---|---|---|
Labour | Henry Usborne | 22,800 | 53.15 | ||
Conservative | Albert E. Shaw | 20,099 | 46.85 | ||
Majority | 2,701 | 6.30 | |||
Turnout | 42,899 | 82.51 | |||
Labour hold | Swing | ||||
Party | Candidate | Votes | % | ±% | |
---|---|---|---|---|---|
Labour | Henry Usborne | 22,342 | 51.16 | ||
Conservative | Gordon Matthews | 18,431 | 42.20 | ||
Liberal | A.S. Ritchie | 2,553 | 5.85 | ||
Communist | Jim Faulkner [24] | 347 | 0.79 | New | |
Majority | 3,911 | 8.96 | |||
Turnout | 43,673 | 84.32 | |||
Labour hold | Swing | ||||
Party | Candidate | Votes | % | ±% | |
---|---|---|---|---|---|
Labour | Wesley Perrins | 33,835 | 60.49 | +18.16 | |
Conservative | Edward Salt | 16,514 | 29.53 | -28.14 | |
Liberal | Charles Frederick Middleton | 5,583 | 9.98 | New | |
Majority | 17,321 | 30.96 | N/A | ||
Turnout | 55,932 | 69.21 | +3.99 | ||
Labour gain from Conservative | Swing | +23.15 | |||
Party | Candidate | Votes | % | ±% | |
---|---|---|---|---|---|
Conservative | Edward Salt | 25,717 | 57.67 | -7.52 | |
Labour | Charles Jarman | 18,879 | 42.33 | +8.50 | |
Majority | 6,838 | 15.34 | -16.02 | ||
Turnout | 44,596 | 65.22 | -12.48 | ||
Conservative hold | Swing | +8.01 | |||
Party | Candidate | Votes | % | ±% | |
---|---|---|---|---|---|
Conservative | Edward Salt | 32,061 | 65.19 | +24.29 | |
Labour | Archibald Gossling | 16,640 | 33.83 | -15.07 | |
New Party | EJ Bartleet | 479 | 0.97 | New | |
Majority | 15,421 | 31.36 | N/A | ||
Turnout | 49,180 | 76.70 | -1.1 | ||
Conservative gain from Labour | Swing | +18.64 | |||
Party | Candidate | Votes | % | ±% | |
---|---|---|---|---|---|
Labour | Archibald Gossling | 23,956 | 48.9 | ![]() | |
Unionist | Edward Salt | 19,590 | 39.9 | ![]() | |
Liberal | Charles Albert Beaumont | 5,500 | 11.2 | New | |
Majority | 4,366 | 9.0 | N/A | ||
Turnout | 49,046 | 77.8 | ![]() | ||
Registered electors | 63,068 | ||||
Labour gain from Unionist | Swing | ![]() | |||
Party | Candidate | Votes | % | ±% | |
---|---|---|---|---|---|
Unionist | Alfred Jephcott | 16,149 | 53.2 | ![]() | |
Labour | Archibald Gossling | 14,184 | 46.8 | ![]() | |
Majority | 1,965 | 6.4 | ![]() | ||
Turnout | 30,333 | 77.3 | ![]() | ||
Registered electors | 39,235 | ||||
Unionist hold | Swing | ![]() | |||
Party | Candidate | Votes | % | ±% | |
---|---|---|---|---|---|
Unionist | Alfred Jephcott | 13,300 | 53.5 | ![]() | |
Labour | Archibald Gossling | 11,562 | 46.5 | ![]() | |
Majority | 1,738 | 7.0 | ![]() | ||
Turnout | 24,862 | 64.4 | ![]() | ||
Registered electors | 38,591 | ||||
Unionist hold | Swing | ![]() | |||
Party | Candidate | Votes | % | ±% | |
---|---|---|---|---|---|
Unionist | Alfred Jephcott | 15,586 | 58.1 | ![]() | |
Labour | Archibald Gossling | 11,234 | 41.9 | ![]() | |
Majority | 4,352 | 16.2 | ![]() | ||
Turnout | 26,820 | 70.5 | ![]() | ||
Registered electors | 38,045 | ||||
Unionist hold | Swing | ![]() | |||
Party | Candidate | Votes | % | ±% | |
---|---|---|---|---|---|
C | Unionist | Alfred Jephcott | 10,960 | 56.3 | |
Labour | George Shann | 7,466 | 38.3 | ||
Liberal | George Jackson | 1,049 | 5.4 | ||
Majority | 3,494 | 18.0 | |||
Turnout | 19,475 | 53.2 | |||
Registered electors | 36,575 | ||||
Unionist win (new seat) | |||||
Cindicates candidate endorsed by the coalition government. |
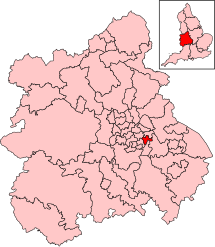
Birmingham Hodge Hill is a constituency of part of the city of Birmingham represented in the House of Commons since 2004 by Liam Byrne, a member of the Labour Party.
Cheadle is a borough constituency represented in the House of Commons of the Parliament of the United Kingdom.
Romford is a constituency in Greater London represented in the House of Commons of the UK Parliament since 2001 by Andrew Rosindell, a Conservative.
Leyton and Wanstead is a constituency in Greater London created in 1997 and represented in the House of Commons of the UK Parliament since 2010 by John Cryer of the Labour Party.
Birmingham Edgbaston is a constituency, represented in the House of Commons of the UK Parliament since 2017 by Preet Gill, a Labour Co-op MP.
Birmingham Selly Oak is a constituency in the West Midlands, represented in the House of Commons of the UK Parliament since 2010 by Steve McCabe of the Labour Party.
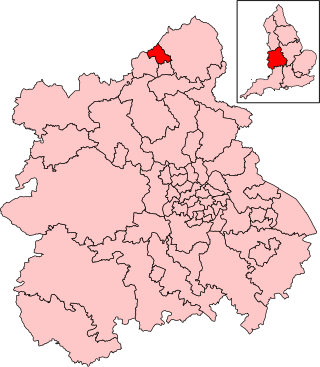
Makerfield is a constituency represented in the House of Commons of the UK Parliament. Like all others, the seat is currently empty due to the dissolution of parliament.
Stoke-on-Trent North is a constituency represented in the House of Commons of the UK Parliament since 2019 by Jonathan Gullis, a member of the Conservative Party.
Stoke-on-Trent South is a constituency created in 1950, and represented in the House of Commons of the UK Parliament since 2017 by Jack Brereton, a Conservative. The local electorate returned a Labour MP in every election until 2017, when Brereton became its first Conservative MP. The seat is non-rural and in the upper valley of the Trent covering half of the main city of the Potteries, a major ceramics centre since the 17th century.
Birmingham Erdington is a parliamentary constituency in Birmingham, England, represented in the House of Commons of the Parliament of the United Kingdom since 2022 by Paulette Hamilton of the Labour Party.
Birmingham Ladywood is a constituency of part of the city of Birmingham, represented in the House of Commons since 2010 by Shabana Mahmood of the Labour Party.
Birmingham Northfield is a constituency represented in the House of Commons of the UK Parliament since 2019 by Gary Sambrook, a Conservative. It represents the southernmost part of the city of Birmingham.
Birmingham Perry Barr is a constituency in the West Midlands, represented in the House of Commons of the UK Parliament since 2001 by Khalid Mahmood of the Labour Party.
Sutton Coldfield is a constituency represented in the House of Commons of the UK Parliament since 2001 by Andrew Mitchell, a Conservative.
Wolverhampton South East is a borough constituency represented in the House of Commons of the Parliament of the United Kingdom. It elects one Member of Parliament (MP) by the first past the post system of election.
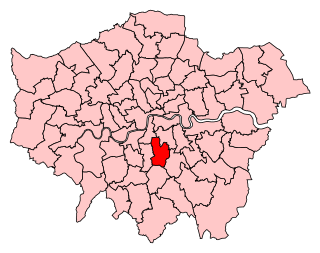
Dulwich and West Norwood is a constituency in South London created in 1997. It has been represented by Helen Hayes of Labour since her election in 2015.
Greenwich and Woolwich is a constituency represented in the House of Commons of the UK Parliament since 2015 by Matthew Pennycook of the Labour Party.
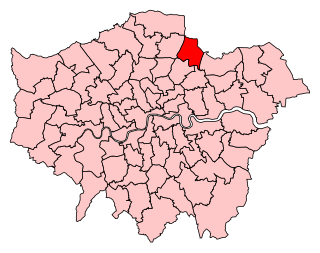
Chingford and Woodford Green is a constituency in North East London represented in the House of Commons of the UK Parliament by Sir Iain Duncan Smith of the Conservative Party since its creation in 1997.
Birmingham Stechford was a parliamentary constituency centred on the Stechford district of the city of Birmingham. It returned one Member of Parliament (MP) to the House of Commons of the Parliament of the United Kingdom, elected by the first-past-the-post voting system.
Acocks Green ward is an electoral ward in south-east Birmingham, England, and following the boundary reorganisation of 1 December 2017 includes the areas of Acocks Green, Stockfield and Fox Hollies.
{{cite web}}
: CS1 maint: archived copy as title (link)