
Analytical chemistry studies and uses instruments and methods used to separate, identify, and quantify matter. In practice, separation, identification or quantification may constitute the entire analysis or be combined with another method. Separation isolates analytes. Qualitative analysis identifies analytes, while quantitative analysis determines the numerical amount or concentration.
In statistics, a central tendency is a central or typical value for a probability distribution. It may also be called a center or location of the distribution. Colloquially, measures of central tendency are often called averages. The term central tendency dates from the late 1920s.
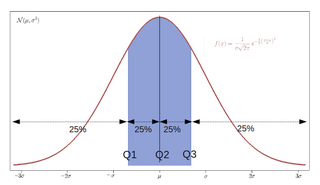
In statistics and probability, quantiles are cut points dividing the range of a probability distribution into continuous intervals with equal probabilities, or dividing the observations in a sample in the same way. There is one fewer quantile than the number of groups created. Common quantiles have special names, such as quartiles, deciles, and percentiles. The groups created are termed halves, thirds, quarters, etc., though sometimes the terms for the quantile are used for the groups created, rather than for the cut points.
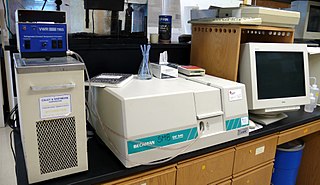
Ultraviolet–visible spectroscopy or ultraviolet–visible spectrophotometry refers to absorption spectroscopy or reflectance spectroscopy in part of the ultraviolet and the full, adjacent visible regions of the electromagnetic spectrum. This means it uses light in the visible and adjacent ranges. The absorption or reflectance in the visible range directly affects the perceived color of the chemicals involved. In this region of the spectrum, atoms and molecules undergo electronic transitions. Absorption spectroscopy is complementary to fluorescence spectroscopy, in that fluorescence deals with transitions of electrons from the excited state to the ground state, while absorption measures transitions from the ground state to the excited state.
Chemometrics is the science of extracting information from chemical systems by data-driven means. Chemometrics is inherently interdisciplinary, using methods frequently employed in core data-analytic disciplines such as multivariate statistics, applied mathematics, and computer science, in order to address problems in chemistry, biochemistry, medicine, biology and chemical engineering. In this way, it mirrors other interdisciplinary fields, such as psychometrics and econometrics.

Cross-validation, sometimes called rotation estimation or out-of-sample testing, is any of various similar model validation techniques for assessing how the results of a statistical analysis will generalize to an independent data set. It is mainly used in settings where the goal is prediction, and one wants to estimate how accurately a predictive model will perform in practice. In a prediction problem, a model is usually given a dataset of known data on which training is run, and a dataset of unknown data against which the model is tested. The goal of cross-validation is to test the model's ability to predict new data that was not used in estimating it, in order to flag problems like overfitting or selection bias and to give an insight on how the model will generalize to an independent dataset.

Spectrophotometry is a branch of electromagnetic spectroscopy concerned with the quantitative measurement of the reflection or transmission properties of a material as a function of wavelength. Spectrophotometry uses photometers, known as spectrophotometers, that can measure the intensity of a light beam at different wavelengths. Although spectrophotometry is most commonly applied to ultraviolet, visible, and infrared radiation, modern spectrophotometers can interrogate wide swaths of the electromagnetic spectrum, including x-ray, ultraviolet, visible, infrared, and/or microwave wavelengths.

Bootstrap aggregating, also called bagging, is a machine learning ensemble meta-algorithm designed to improve the stability and accuracy of machine learning algorithms used in statistical classification and regression. It also reduces variance and helps to avoid overfitting. Although it is usually applied to decision tree methods, it can be used with any type of method. Bagging is a special case of the model averaging approach.

Elemental analysis is a process where a sample of some material is analyzed for its elemental and sometimes isotopic composition. Elemental analysis can be qualitative, and it can be quantitative. Elemental analysis falls within the ambit of analytical chemistry, the set of instruments involved in deciphering the chemical nature of our world.
Linear discriminant analysis (LDA), normal discriminant analysis (NDA), or discriminant function analysis is a generalization of Fisher's linear discriminant, a method used in statistics and other fields, to find a linear combination of features that characterizes or separates two or more classes of objects or events. The resulting combination may be used as a linear classifier, or, more commonly, for dimensionality reduction before later classification.

Inductively coupled plasma atomic emission spectroscopy (ICP-AES), also referred to as inductively coupled plasma optical emission spectrometry (ICP-OES), is an analytical technique used for the detection of chemical elements. It is a type of emission spectroscopy that uses the inductively coupled plasma to produce excited atoms and ions that emit electromagnetic radiation at wavelengths characteristic of a particular element. The plasma is a high temperature source of ionised source gas. The plasma is sustained and maintained by inductive coupling from cooled electrical coils at megahertz frequencies. The source temperature is in the range from 6000 to 10,000 K. The intensity of the emissions from various wavelengths of light are proportional to the concentrations of the elements within the sample.
In statistics, resampling is any of a variety of methods for doing one of the following:
- Estimating the precision of sample statistics by using subsets of available data (jackknifing) or drawing randomly with replacement from a set of data points (bootstrapping)
- Exchanging labels on data points when performing significance tests
- Validating models by using random subsets
The method of standard addition is a type of quantitative analysis approach often used in analytical chemistry whereby the standard is added directly to the aliquots of analyzed sample. This method is used in situations where sample matrix also contributes to the analytical signal, a situation known as the matrix effect, thus making it impossible to compare the analytical signal between sample and standard using the traditional calibration curve approach.
In analytical chemistry, quantitative analysis is the determination of the absolute or relative abundance of one, several or all particular substance(s) present in a sample.
Bootstrapping is any test or metric that uses random sampling with replacement, and falls under the broader class of resampling methods. Bootstrapping assigns measures of accuracy to sample estimates. This technique allows estimation of the sampling distribution of almost any statistic using random sampling methods.
Demand forecasting is a field of predictive analytics which tries to understand and predict customer demand to optimize supply decisions by corporate supply chain and business management. Demand forecasting involves quantitative methods such as the use of data, and especially historical sales data, as well as statistical techniques from test markets. Demand forecasting may be used in production planning, inventory management, and at times in assessing future capacity requirements, or in making decisions on whether to enter a new market.
Acoustic resonance spectroscopy (ARS) is a method of spectroscopy in the acoustic region, primarily the sonic and ultrasonic regions. ARS is typically much more rapid than HPLC and NIR. It is non destructive and requires no sample preparation as the sampling waveguide can simply be pushed into a sample powder/liquid or in contact with a solid sample. To date, the AR spectrometer has successfully differentiated and quantified sample analytes in various forms;. It has been used to measure and monitor the progression of chemical reactions, such as the setting and hardening of concrete from cement paste to solid. Acoustic spectrometry has also been used to measure the volume fraction of colloids in a dispersion medium, as well as for the investigation of physical properties of colloidal dispersions, such as aggregation and particle size distribution. Typically, these experiments are carried out with sinusoidal excitation signals and the experimental observation of signal attenuation. From a comparison of theoretical attenuation to experimental observation, the particle size distribution and aggregation phenomena are inferred.
A variable pathlength cell is a sample holder used for ultraviolet–visible spectroscopy or infrared spectroscopy that has a path length that can be varied to change the absorbance without changing the sample concentration.
In statistics, the Sobel test is a method of testing the significance of a mediation effect. The test is based on the work of Michael E. Sobel, a statistics professor at Columbia University in New York, NY, and is an application of the delta method. In mediation, the relationship between the independent variable and the dependent variable is hypothesized to be an indirect effect that exists due to the influence of a third variable. As a result when the mediator is included in a regression analysis model with the independent variable, the effect of the independent variable is reduced and the effect of the mediator remains significant. The Sobel test is basically a specialized t test that provides a method to determine whether the reduction in the effect of the independent variable, after including the mediator in the model, is a significant reduction and therefore whether the mediation effect is statistically significant.