Brent Crude

Last updated
Oil platform in the North Sea Oil Platform in mist, Cromarty Firth near Rosskeen - geograph.org.uk - 851812.jpg
Oil platform in the North Sea

Brent Crude may refer to any or all of the components of the Brent Complex, a physically and financially traded oil market based around the North Sea of Northwest Europe; colloquially, Brent Crude usually refers to the price of the ICE (Intercontinental Exchange) Brent Crude Oil futures contract or the contract itself. The original Brent Crude referred to a trading classification of sweet light crude oil first extracted from the Brent oilfield in the North Sea in 1976. [1] As production from the Brent oilfield declined to zero in 2021, crude oil blends from other oil fields have been added to the trade classification. The current Brent blend consists of crude oil produced from the Forties (added 2002), Oseberg (added 2002), Ekofisk (added 2007), Troll (added 2018) oil fields (also known as the BFOET Quotation) [2] and oil drilled from Midland, Texas in the Permian Basin (added 2023). [3]

Contents

The Brent Crude oil marker is also known as Brent Blend, London Brent and Brent petroleum. This grade is described as light because of its relatively low density, and sweet because of its low sulphur content.

Brent is the leading global price benchmark for Atlantic basin crude oils. It is used to set the price of two-thirds of the world's internationally traded crude oil supplies. It is one of the two main benchmark prices for purchases of oil worldwide, the other being West Texas Intermediate (WTI).

Brent Complex

Popular media references to "Brent crude" usually refers to the ICE Brent crude oil futures price. The ICE Brent crude oil futures price is part of the Brent Complex, a physical and financial market for crude oil based around the North Sea of Northwest Europe, which could include numerous elements that can be referred to as Brent crude:

The Brent Complex fosters commercial transactions of Brent crude oil, gathers price data those transactions (in forwards, CFDs, and Dated Brent), establishes reference prices for other global oil trade transactions (in Dated Brent assessed prices, Dated BFOET assessed prices, forward traded prices, and futures traded prices), [4] and transfers risks of those transactions (through hedging in forward and futures markets). [5]

Brent crude oil futures contracts

Brent crude oil prices (in dollars and euros) Crude oil prices in dollar and euro.png
Brent crude oil prices (in dollars and euros)

ICE Brent crude oil futures

The ICE Futures Europe symbol for Brent crude oil futures is B. It was originally traded on the open outcry International Petroleum Exchange in London starting in 1988, [6] but since 2005 has been traded on the electronic Intercontinental Exchange, known as ICE. One contract equals 1,000 barrels (159 m3) and quoted in U.S. dollars. Up to 96 contracts, for 96 consecutive months, in the Brent crude oil futures contract series are available for trading. For example, before the last trading date for May 2020, 96 contracts, from contracts for May 2020, June 2020, July 2020 ... Mar 2028, April 2028, and May 2028 are available for trading. ICE Clear Europe acts as the central counterparty for Brent crude oil and related contracts. Brent contracts are deliverable contracts based on 'Exchange of Futures for Physicals' (EFP) delivery with an option to cash settle against the ICE Brent Index price for the last trading day of the futures contract. [7]

CME Brent crude oil futures

In addition to ICE, two types of Brent crude financial futures are also traded on the NYMEX (now part of the Chicago Mercantile Exchange (CME). They are ultimately priced in relation to the ICE Brent crude oil futures and the ICE Brent Index.

Brent Crude Oil Penultimate Financial Futures, also known as Brent Crude Oil Futures, are traded using the symbol BB, and are cash settled based on the ICE Brent Crude Oil Futures 1st nearby contract settlement price on the penultimate trading day for the delivery month. [8]

Brent Last Day Financial Futures, also known as Brent Crude Oil Financial Futures, are traded using the symbol BZ, and are cash settled based on the ICE Brent Crude Oil Index price as published one day after the final trading day for the delivery month. [9]

Role in hedging

Although price discovery for the Brent Complex is driven in the Brent forward market, many hedgers and traders prefer to use futures contracts like the ICE Brent futures contract to avoid the risk of large physical deliveries. If the market participant is using Brent futures to hedge physical oil transactions based on Dated Brent, they will still face basis risk between Dated Brent and EFP prices. Hedgers could use a Crude Diff or 'Dated to Front Line' (DFL) contract, which is a spread contract between Dated Brent and Brent 1st Line Future (the front month future), to hedge the basis risk. So a complete hedge would be the relevant Brent futures contract, and a DFL contract when the futures contract becomes the front month future. This is equivalent to a Brent forward contract and a CFD contract in forward contract terms. [10]

Price difference with WTI

Spot price of West Texas Intermediate in relation to the price of Brent Crude Crude oil spread.svg
Spot price of West Texas Intermediate in relation to the price of Brent Crude
.mw-parser-output .legend{page-break-inside:avoid;break-inside:avoid-column}.mw-parser-output .legend-color{display:inline-block;min-width:1.25em;height:1.25em;line-height:1.25;margin:1px 0;text-align:center;border:1px solid black;background-color:transparent;color:black}.mw-parser-output .legend-text{}
Brent Crude
West Texas Intermediate Brent vs WTI crude oil.webp
  Brent Crude
West Texas Intermediate
Brent Crude
Urals oil (Russian export mix)
Dubai Crude
OPEC Reference Basket Oil price benchmarks.webp
  Brent Crude
   Urals oil (Russian export mix)

Historically, price differences between Brent and other index crudes have been based on physical differences in crude oil specifications and short-term variations in supply and demand. Prior to September 2010, there existed a typical price difference per barrel of between ±3 USD/bbl compared to WTI and OPEC Basket; however, since the autumn of 2010 Brent has been priced much higher than WTI, reaching a difference of more than $11 a barrel by the end of February 2011 (WTI: US$104/bbl, LCO: US$116/bbl). In February 2011 the divergence reached $16 during a supply glut, record stockpiles, at Cushing, Oklahoma before peaking at above $23 in August 2012. It has since (September 2012) decreased significantly to around $18 after refinery maintenance settled down and supply issues eased slightly.

Many reasons have been given for this divergence ranging from regional demand variations, to the depletion of the North Sea oil fields.

The US Energy Information Administration attributes the price spread between WTI and Brent to an oversupply of crude oil in the interior of North America (WTI price is set at Cushing, Oklahoma) caused by rapidly increasing oil production from unconventional reservoirs such as Canadian oil sands and tight oil formations such as the Bakken Formation, Niobrara Formation, and Eagle Ford Formation. Oil production in the interior of North America has exceeded the capacity of pipelines to carry it to markets on the Gulf Coast and east coast of North America; as a result, the oil price on the US and Canadian east coast and parts of the US Gulf Coast since 2011 has been set by the price of Brent Crude, while markets in the interior still follow the WTI price. Much US and Canadian crude oil from the interior is now shipped to the coast by railroad, which is much more expensive than pipeline. [11]

April 2020 WTI negative pricing and Brent vulnerability

On April 20, 2020, the CME WTI futures contract for May 2020 settled at −US$37.63 a barrel due to oil demand shocks from the COVID-19 pandemic, and to dwindling storage capacity at the futures contract delivery point at Cushing, Oklahoma. [12] Brent settled for US$26.21 at the same time, for a difference of $63.84. [13] While the oil demand shock and limited storage capacity affects both WTI and Brent futures contracts, Brent contracts have greater access to storage, and greater buffers to absorb demand shocks than the WTI contracts. Brent futures contracts could theoretically access the storage capacity of all the shore tanks in North West Europe and of available shipping storage, while CME WTI contracts are restricted to storage and pipeline capacity at Cushing only. Brent futures contracts are traded in relation with Dated Brent and other contracts in the Brent Complex, allowing other contracts in the system to absorb demand shocks. Up to April 20, most of the demand shock from the COVID-19 pandemic has been absorbed by Dated Brent contracts and Dated Brent quality differentials, which spared pricing pressure on Brent futures contracts. While Brent is more insulated to negative pricing by these factors than WTI, negative prices are still possible should oil demand and storage capacity fall further. [14]

Brent crude oil monthly forward contracts

Brent crude oil monthly forward contracts started trading in 1983 as "open" contracts, or contracts that specify delivery month but not the delivery date. From 1983 to 1985, these contracts were for 500,000 barrels of Brent Blend crude, and were increased to 600,000 barrels after 1985. Deals were made bilaterally between two parties by telephone and confirmed by telex. Payment for deals were made 30 days after oil delivery. Since deals were bilateral and not centrally cleared like futures transactions, parties to the deal sought financial guarantees such as letters of credit to minimize counterparty credit risk. Contracts for one and two months forward were available in 1983, contracts for three months forward were available in 1984, contracts for four months forward were available in 1985, and contracts for at least four months are available for trading today. [15] [16] Sellers of Brent forward contracts initially had to give buyers a notice of at least 15 days of intention to deliver. [17] More recently, the notice period has expanded to 10 days to one month ahead. This shifted the front month of the Brent forward contract. For example, on May 4, the Front Month forward contract (also known as M1) is the July contract, the Second Month (M2) contract is the August contract, and the Third Month (M3) contract is the September contract. [18]

Producers and refiners buy and sell oil on the market for wholesale trade, hedging, and tax purposes. Producers without integrated refinery operations, and vice versa for refiners without oil production, had to sell oil and could hedge oil price risk with forward contracts. Integrated oil producers (those with refinery operations) had the same motives, but had an extra incentive to lower taxes. Integrated oil producers faced taxes when transferring oil internally from production to refining operations. These taxes are calculated based on a reference price originally set by BNOC and eventually calculated as a 30-day price average of spot prices before an oil transaction. Forward market prices tended to be lower than these reference prices a lot of the times, and integrated oil producers could profitably lower their tax obligations by selling oil on the forward market from their production operations, and buying back oil from unrelated parties for their refining operations on the same market. [19] This practice became less prevalent with the introduction of tougher regulations in 1987. [20]

Speculators became bilateral intermediaries between producers and refiners, and speculative deals came to dominate the forward market. Since there was no central clearing of those forward contracts, speculators who bought Brent forwards at the time and who do not want to take delivery of physical oil must find other parties to take the oil, and long chains of speculators formed between producers and refiners for every cargo of oil traded. [21] Integrated oil producers also blurred the lines between commercial and speculative activity, as they could re-direct physical oil cargoes, and choose which forward contracts to deliver and which contracts to pass on to other speculators or producers. [22]

Front Month Brent forward contracts prices came to be used as reference prices for spot transactions, but became vulnerable to speculative squeezes. The development of a Dated Brent and Forward Month Brent Contracts-for-Difference market increased this vulnerability, and market participants gradually switched to using Dated Brent as the spot transaction reference price by 1988. [23] [24]

Brent crude oil contract-for-difference (CFD)

Brent crude oil contract-for-difference (CFD) is a weekly spread or swap between the Dated Brent assessed price and the Second Month (or M2) Brent crude oil forward contract. They trade over a five-day work week in volumes of 100 or 100,000 lots and the most recent CFD rolls to the next-week CFD on Thursday. [25] [26] The CFD market developed in 1988 in response to basis risk between the Brent futures/forward contract prices and the spot/dated Brent prices. [27]

Dated Brent assessed prices and the Brent spot market

In contrast to open forward contracts, Brent crude oil "dated" contracts – known as dated Brent contracts – specify the delivery date of crude in the current month in the spot market. [28] [29] Spot market transactions are generally not public, so market participants usually analyzed Dated Brent prices using assessments from Price Reporting Agencies (PRAs), who collect private transactions data and aggregate them. The important PRAs for the Brent Complex are Platts, Argus, and ICIS. Platts dominates the assessed Dated Brent price, Argus publishes a BFOET assessed crude price called Argus North Sea Dated crude price, and ICIS provides the final settlement data to the ICE Brent Index (which ultimately settles ICE Brent futures) since 2015. [30] [31]

However, in the early 1990s, Brent and BFOET crude spot markets started to price transactions using assessed Dated Brent prices as benchmark prices, which created a feedback loop that diluted fundamental supply and demand information contained in the assessed Dated Brent price, and created incentives for speculative squeezes. [32]

Platts and other PRAs got around the problem by quoting both a dated Brent assessed on outright spot market transactions, and a "North Sea Date Brent Strip" assessed using a Front Month Brent forward price curve created out of adding the Brent Front Month contract price and relevant weekly Brent contracts-for-difference (CFD) prices. These dated Brent prices became less vulnerable to speculative squeezes, since market actors who try to corner the spot market will find that other market participants can sell on the front month forward market or on prices referenced to a front month forward market price, and market actors who try to monopolize the front month forward market will find that they would lose what they earned in the forward market in the spot market, as price effect they created in the front month contract will pass on to the dated Brent prices. [32] [33]

Platt's compile their assessment prices during price assessment 'windows', or specific times of market trading, usually close to the end of trading for a particular day. Trading in these windows are dominated by group of major market participants, as listed in the table below. [32]

Trading activity in the Platt's price assessment ‘window’ by participant from 2016 to May 16, 2019 [32]
RankBrent BFOET ForwardsRankCFDs
1Shell International Trading and Shipping Company16.47%1Vitol SA11.83%
2Vitol SA11.62%2Gunvor SA11.04%
3Glencore Commodities Ltd.10.01%3BP Oil International9.99%
4Gunvor SA10.57%4Mercuria Energy Trading SA9.86%
5Hartree Partners, LP9.80%5Shell International Trading and Shipping Company8.19%
6Mercuria Energy Trading SA9.37%6China Oil & Petroineos8.59%
7SOCAR Trading UK Limited8.94%7Statoil ASA7.67%
Others23.24%Others32.84%
Total100.00%Total100.00%

Brent oilfield crude oil blend

Originally Brent Crude was produced from the Brent Oilfield. The name "Brent" comes from the naming policy of Shell UK Exploration and Production, operating on behalf of ExxonMobil and Royal Dutch Shell, which originally named all of its fields after birds (in this case the brent goose). [34] [35] [36] [37] But it is also a backronym or mnemonic for the formation layers of the oil field: Broom, Rannoch, Etive, Ness and Tarbert. [38]

Petroleum production from Europe, Africa, and the Middle East flowing West tends to be priced relative to this oil, i.e. it forms a benchmark. The other well-known classifications (also called references or benchmarks) are the OPEC Reference Basket, Dubai Crude, Oman Crude, Shanghai Crude, Urals oil and West Texas Intermediate (WTI).

Characteristics

Oil from Ekofisk North Sea Oil IMG 0569 Ekofisk.JPG
Oil from Ekofisk

Brent blend is a light crude oil (LCO), though not as light as West Texas Intermediate (WTI). It contains approximately 0.37% of sulphur, classifying it as sweet crude, yet not as sweet as WTI. Brent is suitable for production of petrol and middle distillates. It is typically refined in Northwest Europe.

Brent Crude has a density of approximately 835 kg/m3, being equivalent to a specific gravity of 0.835 or an API gravity of 38.06.

Brent Index

The Brent Index [39] is the cash settlement price for the Intercontinental Exchange (ICE) Brent Future based on ICE Futures Brent index at expiry.

The index represents the average price of trading in the 25-day Brent Blend, Forties, Oseberg, Ekofisk (BFOE) market in the relevant delivery month as reported and confirmed by the industry media. Only published cargo size (600,000 barrels (95,000 m3)) trades and assessments are taken into consideration.

The index is calculated as an average of the following elements:

  1. A weighted average of first month cargo trades in the 25-day BFOE market.
  2. A weighted average of second month cargo trades in the 25-day BFOE market plus or minus a straight average of the spread trades between the first and second months.
  3. A straight average of designated assessments published in media reports.

See also

Related Research Articles

<span class="mw-page-title-main">Commodity market</span> Physical or virtual transactions of buying and selling involving raw or primary commodities

A commodity market is a market that trades in the primary economic sector rather than manufactured products, such as cocoa, fruit and sugar. Hard commodities are mined, such as gold and oil. Futures contracts are the oldest way of investing in commodities. Commodity markets can include physical trading and derivatives trading using spot prices, forwards, futures, and options on futures. Farmers have used a simple form of derivative trading in the commodity market for centuries for price risk management.

<span class="mw-page-title-main">Contango</span> Situation when futures prices are above the expected spot price at maturity

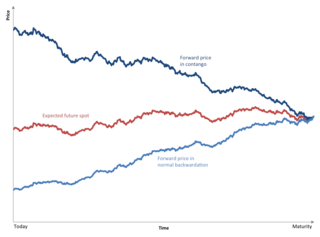
Contango is a situation where the futures price of a commodity is higher than the expected spot price of the contract at maturity. In a contango situation, arbitrageurs or speculators are "willing to pay more [now] for a commodity [to be received] at some point in the future than the actual expected price of the commodity [at that future point]. This may be due to people's desire to pay a premium to have the commodity in the future rather than paying the costs of storage and carry costs of buying the commodity today." On the other side of the trade, hedgers are happy to sell futures contracts and accept the higher-than-expected returns. A contango market is also known as a normal market, or carrying-cost market.

<span class="mw-page-title-main">West Texas Intermediate</span> Grade of crude oil used as a benchmark in oil pricing

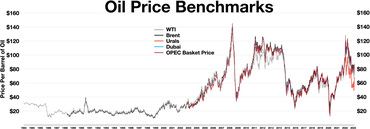
West Texas Intermediate (WTI) is a grade or mix of crude oil; the term is also used to refer to the spot price, the futures price, or assessed price for that oil. In colloquial usage, WTI usually refers to the WTI Crude Oil futures contract traded on the New York Mercantile Exchange (NYMEX). The WTI oil grade is also known as Texas light sweet. Oil produced from any location can be considered WTI if the oil meets the required qualifications. Spot and futures prices of WTI are used as a benchmark in oil pricing. This grade is described as light crude oil because of its low density and sweet because of its low sulfur content.

The International Exchange, now ICE Futures, based in London, was one of the world's largest energy futures and options exchanges. Its flagship commodity, Brent Crude was a world benchmark for oil prices, but the exchange also handled futures contracts and options on fuel oil, natural gas, electricity, coal contracts and, as of 22 April 2005, carbon emission allowances with the European Climate Exchange (ECX).

In finance, a contract for difference (CFD) is a legally binding agreement that creates, defines, and governs mutual rights and obligations between two parties, typically described as "buyer" and "seller", stipulating that the buyer will pay to the seller the difference between the current value of an asset and its value at contract time. If the closing trade price is higher than the opening price, then the seller will pay the buyer the difference, and that will be the buyer's profit. The opposite is also true. That is, if the current asset price is lower at the exit price than the value at the contract's opening, then the seller, rather than the buyer, will benefit from the difference.

Light crude oil is liquid petroleum that has a low density and flows freely at room temperature. It has a low viscosity, low specific gravity and high API gravity due to the presence of a high proportion of light hydrocarbon fractions. It generally has a low wax content. Light crude oil receives a higher price than heavy crude oil on commodity markets because it produces a higher percentage of gasoline and diesel fuel when converted into products by an oil refinery.

An energy derivative is a derivative contract based on an underlying energy asset, such as natural gas, crude oil, or electricity. Energy derivatives are exotic derivatives and include exchange-traded contracts such as futures and options, and over-the-counter derivatives such as forwards, swaps and options. Major players in the energy derivative markets include major trading houses, oil companies, utilities, and financial institutions.

<span class="mw-page-title-main">Price of oil</span> Spot price of a barrel of benchmark crude oil

The price of oil, or the oil price, generally refers to the spot price of a barrel of benchmark crude oil—a reference price for buyers and sellers of crude oil such as West Texas Intermediate (WTI), Brent Crude, Dubai Crude, OPEC Reference Basket, Tapis crude, Bonny Light, Urals oil, Isthmus, and Western Canadian Select (WCS). Oil prices are determined by global supply and demand, rather than any country's domestic production level.

<span class="mw-page-title-main">Benchmark (crude oil)</span> Reference price for trading of an oil commodity

A benchmark crude or marker crude is a crude oil that serves as a reference price for buyers and sellers of crude oil. There are three primary benchmarks, West Texas Intermediate (WTI), Brent Blend, and Dubai Crude. Other well-known blends include the OPEC Reference Basket used by OPEC, Tapis Crude which is traded in Singapore, Western Canadian Select used in Canada, Bonny Light used in Nigeria, Urals oil used in Russia and Mexico's Isthmus. Energy Intelligence Group publishes a handbook which identified 195 major crude streams or blends in its 2011 edition.

The Dubai Mercantile Exchange (DME) is a commodity exchange based in Dubai currently listing its flagship futures contract, DME Oman Crude Oil Futures Contract (OQD). Launched in 2007, the DME aims to become the crude oil pricing benchmark for the Asian market with its Oman Crude Oil contract, like the Intercontinental Exchange’s (ICE) North Sea Brent is to Europe and the New York Mercantile Exchange’s (NYMEX) West Texas Intermediate is to North America.

The Deutsche Bank Liquid Commodity Index (DBLCI) was launched in February 2003. It tracks the performance of six commodities in the energy, precious metals, industrial metals and grain sectors. The DBLCI has constant weightings for each of the six commodities and the index is rebalanced annually in the first week of November. Consequently, the weights fluctuate during the year according to the price movement of the underlying commodity futures.

<span class="mw-page-title-main">World oil market chronology from 2003</span> Chronology of events affecting the oil market

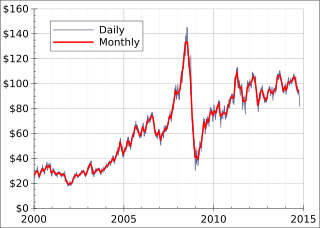
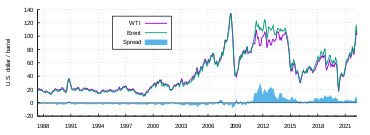
From the mid-1980s to September 2003, the inflation adjusted price of a barrel of crude oil on NYMEX was generally under $25/barrel. Then, during 2004, the price rose above $40, and then $60. A series of events led the price to exceed $60 by August 11, 2005, leading to a record-speed hike that reached $75 by the middle of 2006. Prices then dropped back to $60/barrel by the early part of 2007 before rising steeply again to $92/barrel by October 2007, and $99.29/barrel for December futures in New York on November 21, 2007. Throughout the first half of 2008, oil regularly reached record high prices. Prices on June 27, 2008, touched $141.71/barrel, for August delivery in the New York Mercantile Exchange, amid Libya's threat to cut output, and OPEC's president predicted prices may reach $170 by the Northern summer. The highest recorded price per barrel maximum of $147.02 was reached on July 11, 2008. After falling below $100 in the late summer of 2008, prices rose again in late September. On September 22, oil rose over $25 to $130 before settling again to $120.92, marking a record one-day gain of $16.37. Electronic crude oil trading was temporarily halted by NYMEX when the daily price rise limit of $10 was reached, but the limit was reset seconds later and trading resumed. By October 16, prices had fallen again to below $70, and on November 6 oil closed below $60. Then in 2009, prices went slightly higher, although not to the extent of the 2005–2007 crisis, exceeding $100 in 2011 and most of 2012. Since late 2013 the oil price has fallen below the $100 mark, plummeting below the $50 mark one year later.

Tapis crude is a Malaysian crude oil used as a pricing benchmark in Singapore. Tapis is very light, with an API gravity of 43°-45°, and very sweet, with only about 0.04% sulfur. While it is not traded on a market like Brent Crude or West Texas Intermediate (WTI), it is often used as an oil marker or price referencing indicator for Asia and Australia.

Launched by the Dubai Mercantile Exchange (DME) on 1 June 2007, the DME Oman Crude Oil Futures Contract (OQD) is the Asian crude oil pricing benchmark. The contract is traded on the CME Group’s electronic platform CME Globex, and cleared through CME Clearport.

Western Canadian Select (WCS) is a heavy sour blend of crude oil that is one of North America's largest heavy crude oil streams and, historically, its cheapest. It was established in December 2004 as a new heavy oil stream by EnCana (now Cenovus), Canadian Natural Resources, Petro-Canada (now Suncor) and Talisman Energy (now Repsol Oil & Gas Canada). It is composed mostly of bitumen blended with sweet synthetic and condensate diluents and 21 existing streams of both conventional and unconventional Alberta heavy crude oils at the large Husky Midstream General Partnership terminal in Hardisty, Alberta. Western Canadian Select—the benchmark for heavy, acidic (TAN <1.1) crudes—is one of many petroleum products from the Western Canadian Sedimentary Basin oil sands. Calgary-based Husky Energy, now a subsidiary of Cenovus, had joined the initial four founders in 2015.

The Canadian Crude Oil Index (CCI) serves as a benchmark for oil produced in Canada. It allows investors to track the price, risk, and volatility of the Canadian commodity.

<span class="mw-page-title-main">2020 Russia–Saudi Arabia oil price war</span> 2020 oil price war between Russia and Saudi Arabia

On 8 March 2020, Saudi Arabia initiated a price war on oil with Russia, which facilitated a 65% quarterly fall in the price of oil. The price war was triggered by a break-up in dialogue between the Organization of the Petroleum Exporting Countries (OPEC) and Russia over proposed oil-production cuts in the midst of the COVID-19 pandemic. Russia walked out of the agreement, leading to the fall of the OPEC+ alliance.

References

  1. "Platts Dated Brent vs other 'Brents'" (PDF). p. 1. Retrieved 2020-05-15.
  2. Imsirovic, Adi. "Changes to the 'Dated Brent' benchmark: More to come" (PDF). The Oxford Institute for Energy Studies. p. 3. Retrieved 2020-05-15.
  3. Uberti, David; Henderson, Bob; Wallace, Joe (2023-05-31). "Move Over, Scotland. U.S. Oil Enters World's Most Important Benchmark". WSJ. Retrieved 2023-09-04.
  4. Fattouh, Bassam; Imsirovic, Adi. "Contracts for Difference and the Evolution of the Brent Complex" (PDF). The Oxford Institute for Energy Studies. Retrieved 2020-05-16.
  5. Abdullahi, Saada A.; Muhammad, Zahid (2016), Price discovery and risk transfer in the Brent crude oil futures market, vol. 5, International Journal of Financial Markets and Derivatives, pp. 23–35
  6. "The Role of WTI as a Crude Oil Benchmark" (PDF). Purvin & Gertz Inc. p. 109.
  7. "Brent Crude Futures". Intercontinental Exchange, Inc.
  8. "Chapter 692: Brent Crude Oil Penultimate Financial Futures" (PDF). CME Group.
  9. "Chapter 698: Brent Crude Oil Last Day Financial Futures" (PDF). CME Group.
  10. Fattouh, Bassam; Imsirovic, Adi. "Contracts for Difference and the Evolution of the Brent Complex" (PDF). The Oxford Institute for Energy Studies. Retrieved 2020-05-16.
  11. US Energy Information Administration, Short-Term Energy Outlook Supplement: Brent Crude Oil Spot Price Forecast, 10 July 2010.
  12. Kelly, Stephanie (20 April 2020). "Historic day for oil markets as WTI crude crashes below zero for first time". Financial Post. Retrieved 2020-05-25.
  13. Wallace, Cameron (20 April 2020). "HWTI crude price goes negative for the first time in history". World Oil. Retrieved 2020-05-25.
  14. Fattouh, Bassam; Imsirovic, Adi. "Oil Benchmarks Under Stress" (PDF). The Oxford Institute for Energy Studies. Retrieved 2020-05-25.
  15. Bacon, Robert. "The Brent Market An Analysis of Recent Developments" (PDF). The Oxford Institute for Energy Studies. pp. 3–4. Retrieved 2020-05-16.
  16. "Specifications guide Europe and Africa crude oil" (PDF). S&P Global Platts. 2020. Retrieved 2020-05-16.
  17. Bacon, Robert. "The Brent Market An Analysis of Recent Developments" (PDF). The Oxford Institute for Energy Studies. pp. 3–4. Retrieved 2020-05-16.
  18. Fattouh, Bassam; Imsirovic, Adi. "Contracts for Difference and the Evolution of the Brent Complex" (PDF). The Oxford Institute for Energy Studies. Retrieved 2020-05-16.
  19. Bacon, Robert. "The Brent Market An Analysis of Recent Developments" (PDF). The Oxford Institute for Energy Studies. pp. 35–38. Retrieved 2020-05-16.
  20. Fattouh, Bassam. "An Anatomy of the Crude Oil Pricing System" (PDF). The Oxford Institute for Energy Studies. pp. 35–38. Retrieved 2020-05-16.
  21. Bacon, Robert. "The Brent Market An Analysis of Recent Developments" (PDF). The Oxford Institute for Energy Studies. pp. 4–5. Retrieved 2020-05-16.
  22. Bacon, Robert. "The Brent Market An Analysis of Recent Developments" (PDF). The Oxford Institute for Energy Studies. p. 39. Retrieved 2020-05-16.
  23. Fattouh, Bassam; Imsirovic, Adi. "Contracts for Difference and the Evolution of the Brent Complex" (PDF). The Oxford Institute for Energy Studies. Retrieved 2020-05-16.
  24. Barrera-Rey, Fernando; Seymour, Adam. "The Brent Contract for Differences (CFD): A Study of an Oil Trading Instrument, its Market and its Influence on the Behaviour of Oil Prices" (PDF). The Oxford Institute for Energy Studies. pp. 3–4. Retrieved 2020-05-16.
  25. "Specifications guide Europe and Africa crude oil" (PDF). S&P Global Platts. 2020. Retrieved 2020-05-16.
  26. Fattouh, Bassam; Imsirovic, Adi. "Contracts for Difference and the Evolution of the Brent Complex" (PDF). The Oxford Institute for Energy Studies. Retrieved 2020-05-16.
  27. Barrera-Rey, Fernando; Seymour, Adam. "Executive Summary" (PDF). The Brent Contract for Differences (CFD): A Study of an Oil Trading Instrument, its Market and its Influence on the Behaviour of Oil Prices. The Oxford Institute for Energy Studies. pp. 3–4. Retrieved 2020-05-16.
  28. "Platts Dated Brent vs other 'Brents'" (PDF). p. 1. Retrieved 2020-05-15.
  29. Bacon, Robert. "The Brent Market An Analysis of Recent Developments" (PDF). The Oxford Institute for Energy Studies. p. 3. Retrieved 2020-05-16.
  30. Johnson, Owain (2017-08-09), The Price Reporters: A Guide to PRAs and Commodity Benchmarks (1 ed.), Routledge
  31. Crude: ARGUS North Sea Dated price assessment, Argus Media, retrieved 2020-05-16
  32. 1 2 3 4 Fattouh, Bassam; Imsirovic, Adi. "Contracts for Difference and the Evolution of the Brent Complex" (PDF). The Oxford Institute for Energy Studies. Retrieved 2020-05-16.
  33. "Specifications guide Europe and Africa crude oil" (PDF). S&P Global Platts. 2020. Retrieved 2020-05-16.
  34. "UK brent, crude oil, brent crude". One Financial Markets/CB Financial Services Ltd. 2012. Archived from the original on 7 March 2012. Retrieved 25 March 2012.
  35. "ベーシックな支払い方法について". www.investing-for-beginner.org. Archived from the original on 2012-12-25. Retrieved 23 March 2018.
  36. "Shell's floating monster spill • Friends of the Earth". foe.org. 24 December 2011. Retrieved 23 March 2018.
  37. Andrew Inkpen, Michael H. Moffet. The Global Oil &Gas Industry. PennWell Corporation, Oklahoma, 2011. p. 372. ISBN   978-1-59370-239-7.
  38. The Brent Group, Uppermost Lower Jurassic to Middle Jurassic (Upper Toarcian–Bajocian). Archived 2016-05-08 at the Wayback Machine . Compiled CO2 atlas for the Norwegian Continental Shelf, 2014, Norwegian Petroleum Directorate
  39. IntercontinentalExchange, Inc (2008-01-21), The Brent Index (PDF), retrieved 2010-04-28