
In probability theory and statistics, the exponential distribution or negative exponential distribution is the probability distribution of the distance between events in a Poisson point process, i.e., a process in which events occur continuously and independently at a constant average rate; the distance parameter could be any meaningful mono-dimensional measure of the process, such as time between production errors, or length along a roll of fabric in the weaving manufacturing process. It is a particular case of the gamma distribution. It is the continuous analogue of the geometric distribution, and it has the key property of being memoryless. In addition to being used for the analysis of Poisson point processes it is found in various other contexts.

The Pareto distribution, named after the Italian civil engineer, economist, and sociologist Vilfredo Pareto, is a power-law probability distribution that is used in description of social, quality control, scientific, geophysical, actuarial, and many other types of observable phenomena; the principle originally applied to describing the distribution of wealth in a society, fitting the trend that a large portion of wealth is held by a small fraction of the population. The Pareto principle or "80-20 rule" stating that 80% of outcomes are due to 20% of causes was named in honour of Pareto, but the concepts are distinct, and only Pareto distributions with shape value of log45 ≈ 1.16 precisely reflect it. Empirical observation has shown that this 80-20 distribution fits a wide range of cases, including natural phenomena and human activities.

In probability and statistics, Student's t distribution is a continuous probability distribution that generalizes the standard normal distribution. Like the latter, it is symmetric around zero and bell-shaped.

Value at risk (VaR) is a measure of the risk of loss of investment/Capital. It estimates how much a set of investments might lose, given normal market conditions, in a set time period such as a day. VaR is typically used by firms and regulators in the financial industry to gauge the amount of assets needed to cover possible losses.
In probability theory and statistics, the logistic distribution is a continuous probability distribution. Its cumulative distribution function is the logistic function, which appears in logistic regression and feedforward neural networks. It resembles the normal distribution in shape but has heavier tails. The logistic distribution is a special case of the Tukey lambda distribution.
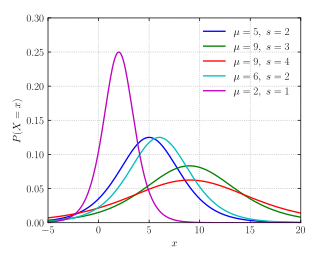
In probability theory and statistics, the generalized extreme value (GEV) distribution is a family of continuous probability distributions developed within extreme value theory to combine the Gumbel, Fréchet and Weibull families also known as type I, II and III extreme value distributions. By the extreme value theorem the GEV distribution is the only possible limit distribution of properly normalized maxima of a sequence of independent and identically distributed random variables. Note that a limit distribution needs to exist, which requires regularity conditions on the tail of the distribution. Despite this, the GEV distribution is often used as an approximation to model the maxima of long (finite) sequences of random variables.
In statistics and information theory, a maximum entropy probability distribution has entropy that is at least as great as that of all other members of a specified class of probability distributions. According to the principle of maximum entropy, if nothing is known about a distribution except that it belongs to a certain class, then the distribution with the largest entropy should be chosen as the least-informative default. The motivation is twofold: first, maximizing entropy minimizes the amount of prior information built into the distribution; second, many physical systems tend to move towards maximal entropy configurations over time.
In the fields of actuarial science and financial economics there are a number of ways that risk can be defined; to clarify the concept theoreticians have described a number of properties that a risk measure might or might not have. A coherent risk measure is a function that satisfies properties of monotonicity, sub-additivity, homogeneity, and translational invariance.
Expected shortfall (ES) is a risk measure—a concept used in the field of financial risk measurement to evaluate the market risk or credit risk of a portfolio. The "expected shortfall at q% level" is the expected return on the portfolio in the worst of cases. ES is an alternative to value at risk that is more sensitive to the shape of the tail of the loss distribution.
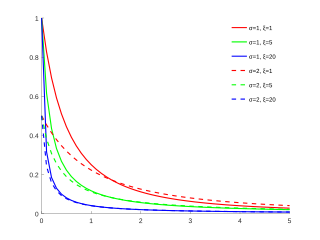
In statistics, the generalized Pareto distribution (GPD) is a family of continuous probability distributions. It is often used to model the tails of another distribution. It is specified by three parameters: location , scale , and shape . Sometimes it is specified by only scale and shape and sometimes only by its shape parameter. Some references give the shape parameter as .
In financial mathematics, tail value at risk (TVaR), also known as tail conditional expectation (TCE) or conditional tail expectation (CTE), is a risk measure associated with the more general value at risk. It quantifies the expected value of the loss given that an event outside a given probability level has occurred.

In probability and statistics, the log-logistic distribution is a continuous probability distribution for a non-negative random variable. It is used in survival analysis as a parametric model for events whose rate increases initially and decreases later, as, for example, mortality rate from cancer following diagnosis or treatment. It has also been used in hydrology to model stream flow and precipitation, in economics as a simple model of the distribution of wealth or income, and in networking to model the transmission times of data considering both the network and the software.
The term generalized logistic distribution is used as the name for several different families of probability distributions. For example, Johnson et al. list four forms, which are listed below.
Financial models with long-tailed distributions and volatility clustering have been introduced to overcome problems with the realism of classical financial models. These classical models of financial time series typically assume homoskedasticity and normality cannot explain stylized phenomena such as skewness, heavy tails, and volatility clustering of the empirical asset returns in finance. In 1963, Benoit Mandelbrot first used the stable distribution to model the empirical distributions which have the skewness and heavy-tail property. Since -stable distributions have infinite -th moments for all , the tempered stable processes have been proposed for overcoming this limitation of the stable distribution.

Ralph Tyrrell Rockafellar is an American mathematician and one of the leading scholars in optimization theory and related fields of analysis and combinatorics. He is the author of four major books including the landmark text "Convex Analysis" (1970), which has been cited more than 27,000 times according to Google Scholar and remains the standard reference on the subject, and "Variational Analysis" for which the authors received the Frederick W. Lanchester Prize from the Institute for Operations Research and the Management Sciences (INFORMS).

The Lomax distribution, conditionally also called the Pareto Type II distribution, is a heavy-tail probability distribution used in business, economics, actuarial science, queueing theory and Internet traffic modeling. It is named after K. S. Lomax. It is essentially a Pareto distribution that has been shifted so that its support begins at zero.
In financial mathematics, a deviation risk measure is a function to quantify financial risk in a different method than a general risk measure. Deviation risk measures generalize the concept of standard deviation.
In financial mathematics and stochastic optimization, the concept of risk measure is used to quantify the risk involved in a random outcome or risk position. Many risk measures have hitherto been proposed, each having certain characteristics. The entropic value at risk (EVaR) is a coherent risk measure introduced by Ahmadi-Javid, which is an upper bound for the value at risk (VaR) and the conditional value at risk (CVaR), obtained from the Chernoff inequality. The EVaR can also be represented by using the concept of relative entropy. Because of its connection with the VaR and the relative entropy, this risk measure is called "entropic value at risk". The EVaR was developed to tackle some computational inefficiencies of the CVaR. Getting inspiration from the dual representation of the EVaR, Ahmadi-Javid developed a wide class of coherent risk measures, called g-entropic risk measures. Both the CVaR and the EVaR are members of this class.
The Rachev Ratio is a risk-return performance measure of an investment asset, portfolio, or strategy. It was devised by Dr. Svetlozar Rachev and has been extensively studied in quantitative finance. Unlike the reward-to-variability ratios, such as Sharpe ratio and Sortino ratio, the Rachev ratio is a reward-to-risk ratio, which is designed to measure the right tail reward potential relative to the left tail risk in a non-Gaussian setting. Intuitively, it represents the potential for extreme positive returns compared to the risk of extreme losses, at a rarity frequency q defined by the user.
In statistical decision theory, a randomised decision rule or mixed decision rule is a decision rule that associates probabilities with deterministic decision rules. In finite decision problems, randomised decision rules define a risk set which is the convex hull of the risk points of the nonrandomised decision rules.


