Cardiff Central | |
---|---|
Former Borough constituency for the House of Commons | |
Preserved county | South Glamorgan |
Population | 88,097 (2011 census) [1] |
Electorate | 64,225 (December 2010) [2] |
1983–2024 | |
Seats | One |
Created from | Cardiff North and Cardiff South East [3] |
Replaced by | Cardiff East,Cardiff South and Penarth |
1918–1950 | |
Seats | One |
Type of constituency | Borough constituency |
Created from | Cardiff |
Replaced by | Cardiff North and Cardiff West |
Senedd | Cardiff Central, South Wales Central |
Cardiff Central (Welsh : Canol Caerdydd) is a borough constituency [n 1] in the city of Cardiff. It returns one Member of Parliament (MP) to the House of Commons of the Parliament of the United Kingdom, elected by the first past the post system. The seat is currently held by Jo Stevens of the Labour Party. She was appointed as Shadow Secretary of State for Digital, Culture, Media and Sport on 6 April 2020.
The constituency is set to be abolished, as part of the 2023 Periodic Review of Westminster constituencies and under the June 2023 final recommendations of the Boundary Commission for Wales for the 2024 United Kingdom general election. Its wards is to be split between Cardiff East and Cardiff South and Penarth. [4]
1918–1950: The County Borough of Cardiff wards of Canton, Cathays, Central, and Riverside.
1983–2010: The City of Cardiff wards of Adamsdown, Cathays, Cyncoed, Pentwyn, Plasnewydd, and Roath.
2010–2024: The Cardiff electoral divisions of Adamsdown, Cathays, Cyncoed, Pentwyn, Penylan, and Plasnewydd.
As its name suggests, Cardiff Central covered the central area of the City of Cardiff. It extended from the area around the Millennium Stadium in the south to Llanishen Golf Course in the north, taking in the City Centre and the University. [5]
This was a Conservative-held three-way marginal constituency throughout the 1980s but since 1997 Labour and the Liberal Democrats have pushed the Conservative candidate into third place. The Liberal Democrats won the equivalent Welsh Assembly seat in 1999 and 2003 and also dominate the wards which make up the seat in elections to Cardiff Council.
The constituency is socially diverse, with both very affluent and very deprived areas. It has a large student population which seems to have helped Labour to win in 1992 and 1997 but thereafter increasingly switched to the Liberal Democrats due to opposition to government plans for reforming student support. This switched yet again in the 2015 general election where students were disillusioned by the broken promises the Liberal Democrats made regarding tuition fees. This was despite the fact that these student loan promises did not apply to Wales, which has a different funding system and MP Jenny Willott had also voted against the English changes in Parliament. [5] [6]
The seat was unchanged in the Fifth Periodical Report of the Parliamentary Boundary Commission for Wales, which took effect at the 2010 general election.
Since the seat's re-creation in 1983, it has been held successively by each of the three main political parties; the Liberal Democrats gained it at the 2005 election after 13 years of Labour representation. The constituency has transformed dramatically from being a Conservative seat for some years, to a Labour–Lib Dem marginal to the safest Labour seat in Wales today.
Election | Member [7] [8] | Party | |
---|---|---|---|
1918 | James Childs Gould | Unionist | |
1924 | Lewis Lougher | Unionist | |
1929 | Ernest Bennett | Labour | |
1931 | National Labour | ||
1945 | George Thomas | Labour | |
1950 | constituency abolished |
Election | Member [8] | Party | |
---|---|---|---|
1983 | Ian Grist | Conservative | |
1992 | Jon Owen Jones | Labour Co-operative | |
2005 | Jenny Willott | Liberal Democrat | |
2015 | Jo Stevens | Labour |
Party | Candidate | Votes | % | ±% | |
---|---|---|---|---|---|
Unionist | James Childs Gould* | 8,542 | 41.1 | N/A | |
Labour | James Edmunds | 4,663 | 22.4 | N/A | |
Liberal | George Frederick Forsdike | 4,172 | 20.1 | N/A | |
Ind. Unionist | Robert Hughes | 3,419 | 16.4 | N/A | |
Majority | 3,879 | 18.7 | N/A | ||
Turnout | 20,796 | 56.9 | N/A | ||
Registered electors | 36,557 | ||||
Unionist win (new seat) |
Party | Candidate | Votes | % | ±% | |
---|---|---|---|---|---|
Unionist | James Childs Gould | 13,885 | 50.0 | +8.9 | |
Labour | James Edmunds | 8,169 | 29.4 | +7.0 | |
Liberal | Charles Fletcher Sanders | 5,732 | 20.6 | +0.5 | |
Majority | 5,716 | 20.6 | +1.9 | ||
Turnout | 27,786 | 74.4 | +17.5 | ||
Registered electors | 37,326 | ||||
Unionist hold | Swing | +1.0 | |||
Party | Candidate | Votes | % | ±% | |
---|---|---|---|---|---|
Unionist | James Childs Gould | 10,261 | 38.4 | -11.6 | |
Labour | James Edmunds | 8,563 | 32.0 | +2.6 | |
Liberal | Ieuan Watkins Evans | 7,923 | 29.6 | +9.0 | |
Majority | 1,698 | 6.4 | -14.2 | ||
Turnout | 26,747 | 71.4 | -3.0 | ||
Registered electors | 37,444 | ||||
Unionist hold | Swing | -7.1 | |||
Party | Candidate | Votes | % | ±% | |
---|---|---|---|---|---|
Unionist | Lewis Lougher | 14,537 | 49.7 | +11.3 | |
Labour | David Pole | 9,864 | 33.8 | +1.8 | |
Liberal | Aneurin Edwards | 4,805 | 16.5 | -13.1 | |
Majority | 4,673 | 15.9 | +9.5 | ||
Turnout | 29,206 | 76.8 | +5.4 | ||
Registered electors | 38,026 | ||||
Unionist hold | Swing | +4.8 | |||
Party | Candidate | Votes | % | ±% | |
---|---|---|---|---|---|
Labour | Ernest Bennett | 14,469 | 39.1 | +5.3 | |
Unionist | Lewis Lougher | 12,903 | 34.9 | -14.8 | |
Liberal | Barnett Janner | 9,623 | 26.0 | +9.5 | |
Majority | 1,566 | 4.2 | N/A | ||
Turnout | 36,995 | 78.2 | +1.4 | ||
Registered electors | 47,282 | ||||
Labour gain from Unionist | Swing | +10.1 | |||
Party | Candidate | Votes | % | ±% | |
---|---|---|---|---|---|
National Labour | Ernest Bennett | 24,120 | 69.2 | N/A | |
Labour | Edward Archbold | 10,758 | 30.8 | -8.3 | |
Majority | 13,362 | 38.4 | N/A | ||
Turnout | 34,878 | 72.6 | -5.6 | ||
Registered electors | 48,065 | ||||
National Labour gain from Labour | Swing | ||||
Party | Candidate | Votes | % | ±% | |
---|---|---|---|---|---|
National Labour | Ernest Bennett | 16,954 | 51.5 | -17.7 | |
Labour | John Dugdale | 12,094 | 36.8 | +6.0 | |
Liberal | William Glanville Brown | 3,863 | 11.7 | N/A | |
Majority | 4,860 | 14.7 | -23.7 | ||
Turnout | 32,911 | 68.7 | -3.9 | ||
Registered electors | 47,912 | ||||
National Labour hold | Swing | ||||
General election 1939–40: Another general election was required to take place before the end of 1940. The political parties had been making preparations for an election to take place from 1939 and by the end of this year, the following candidates had been selected;
Party | Candidate | Votes | % | ±% | |
---|---|---|---|---|---|
Labour | George Thomas | 16,506 | 49.1 | +12.3 | |
Conservative | Charles Stuart Hallinan | 11,982 | 35.7 | N/A | |
Liberal | Peter Hopkin Morgan | 5,121 | 15.2 | +3.5 | |
Majority | 4,524 | 13.4 | N/A | ||
Turnout | 33,609 | 72.3 | +3.6 | ||
Registered electors | 46,505 | ||||
Labour gain from National Labour | Swing | ||||
Party | Candidate | Votes | % | ±% | |
---|---|---|---|---|---|
Conservative | Ian Grist | 16,090 | 41.4 | N/A | |
Liberal | Mike German | 12,638 | 32.6 | N/A | |
Labour | Raymond Davies | 9,387 | 24.2 | N/A | |
Plaid Cymru | Andrew Morgan | 704 | 1.8 | N/A | |
Majority | 3,452 | 8.8 | N/A | ||
Turnout | 38,819 | 72.1 | N/A | ||
Registered electors | 53,815 | ||||
Conservative win (new seat) |
Party | Candidate | Votes | % | ±% | |
---|---|---|---|---|---|
Conservative | Ian Grist | 15,241 | 37.1 | −4.3 | |
Labour | Jon Owen Jones | 13,255 | 32.3 | +8.1 | |
Liberal | Mike German | 12,062 | 29.3 | −3.3 | |
Plaid Cymru | Siân Mair Caiach | 535 | 1.3 | −0.5 | |
Majority | 1,986 | 4.8 | −4.0 | ||
Turnout | 41,093 | 77.6 | +5.5 | ||
Registered electors | 52,980 | ||||
Conservative hold | Swing | −6.2 | |||
Party | Candidate | Votes | % | ±% | |
---|---|---|---|---|---|
Labour Co-op | Jon Owen Jones | 18,014 | 42.0 | +9.7 | |
Conservative | Ian Grist | 14,549 | 33.9 | −3.2 | |
Liberal Democrats | Jenny Randerson | 9,170 | 21.4 | −7.9 | |
Plaid Cymru | Huw Marshall | 748 | 1.7 | +0.4 | |
Green | Christopher Von Ruhland | 330 | 0.8 | N/A | |
Natural Law | Brian Francis | 105 | 0.2 | N/A | |
Majority | 3,465 | 8.1 | N/A | ||
Turnout | 42,916 | 74.3 | −3.3 | ||
Registered electors | 57,716 | ||||
Labour Co-op gain from Conservative | Swing | +6.5 | |||
Party | Candidate | Votes | % | ±% | |
---|---|---|---|---|---|
Labour Co-op | Jon Owen Jones | 18,464 | 43.7 | +1.7 | |
Liberal Democrats | Jenny Randerson | 10,541 | 24.9 | +3.5 | |
Conservative | David Melding | 8,470 | 20.0 | −13.9 | |
Socialist Labour | Terence Burns | 2,230 | 5.3 | N/A | |
Plaid Cymru | Wayne Vernon | 1,504 | 3.6 | +1.9 | |
Referendum | Nick Lloyd | 760 | 1.8 | N/A | |
Monster Raving Loony | Craig James | 204 | 0.5 | N/A | |
Natural Law | Anthony Hobbs | 80 | 0.2 | ±0.0 | |
Majority | 7,923 | 18.8 | +10.7 | ||
Turnout | 42,253 | 70.0 | -4.3 | ||
Registered electors | 60,393 | ||||
Labour Co-op hold | Swing | +7.8 | |||
Party | Candidate | Votes | % | ±% | |
---|---|---|---|---|---|
Labour Co-op | Jon Owen Jones | 13,451 | 38.6 | −5.1 | |
Liberal Democrats | Jenny Willott | 12,792 | 36.7 | +11.8 | |
Conservative | Gregory Walker | 5,537 | 15.9 | −4.1 | |
Plaid Cymru | Richard Rhys Grigg | 1,680 | 4.8 | +1.2 | |
Green | Stephen Bartley | 661 | 1.9 | N/A | |
Socialist Alliance | Julian Goss | 283 | 0.8 | N/A | |
UKIP | Frank Hughes | 221 | 0.6 | N/A | |
ProLife Alliance | Madeleine Jeremy | 217 | 0.6 | N/A | |
Majority | 659 | 1.9 | -16.9 | ||
Turnout | 34,842 | 58.3 | −11.7 | ||
Registered electors | 59,785 | ||||
Labour Co-op hold | Swing | -8.5 | |||
Party | Candidate | Votes | % | ±% | |
---|---|---|---|---|---|
Liberal Democrats | Jenny Willott | 17,991 | 49.8 | +13.1 | |
Labour Co-op | Jon Owen Jones | 12,398 | 34.3 | −4.3 | |
Conservative | Gotz Mohindra | 3,339 | 9.2 | −6.7 | |
Plaid Cymru | Richard Rhys Grigg | 1,271 | 3.5 | −1.3 | |
Respect | Raja Gul-Raiz | 386 | 1.1 | N/A | |
UKIP | Frank Hughes | 383 | 1.1 | +0.5 | |
Independent | Anne Savoury | 168 | 0.5 | N/A | |
New Millennium Bean Party | Captain Beany | 159 | 0.4 | N/A | |
Rainbow Dream Ticket | Catherine Taylor-Dawson | 37 | 0.1 | N/A | |
Majority | 5,593 | 15.5 | N/A | ||
Turnout | 36,132 | 59.2 | +0.9 | ||
Registered electors | 61,079 | ||||
Liberal Democrats gain from Labour Co-op | Swing | +8.7 | |||
Party | Candidate | Votes | % | ±% | |
---|---|---|---|---|---|
Liberal Democrats | Jenny Willott | 14,976 | 41.4 | −8.4 | |
Labour | Jenny Rathbone | 10,400 | 28.8 | −5.5 | |
Conservative | Karen Robson | 7,799 | 21.6 | +12.4 | |
Plaid Cymru | Chris Williams | 1,246 | 3.4 | −0.1 | |
UKIP | Sue Davies | 765 | 2.1 | +1.0 | |
Green | Sam Coates | 575 | 1.6 | N/A | |
TUSC | Ross Saunders | 162 | 0.4 | N/A | |
Monster Raving Loony | Mark Beech | 142 | 0.4 | N/A | |
Independent | Alun Mathias | 86 | 0.2 | N/A | |
Majority | 4,576 | 12.6 | -2.9 | ||
Turnout | 36,151 | 59.1 | -0.1 | ||
Registered electors | 61,165 | ||||
Liberal Democrats hold | Swing | −1.4 | |||
Party | Candidate | Votes | % | ±% | |
---|---|---|---|---|---|
Labour | Jo Stevens | 15,462 | 40.0 | +11.2 | |
Liberal Democrats | Jenny Willott | 10,481 | 27.1 | −14.3 | |
Conservative | Richard Hopkin | 5,674 | 14.7 | −6.9 | |
UKIP | Anthony Raybould | 2,499 | 6.5 | +4.4 | |
Green | Chris Von Ruhland | 2,461 | 6.4 | +4.8 | |
Plaid Cymru | Martin Pollard | 1,925 | 5.0 | +1.6 | |
TUSC | Steve Williams | 110 | 0.3 | −0.1 | |
Independent | Kazimir Hubert | 34 | 0.1 | N/A | |
Rejected ballots | 117 | ||||
Majority | 4,981 | 12.9 | N/A | ||
Turnout | 38,646 | 67.3 | +8.2 | ||
Registered electors | 57,456 | ||||
Labour gain from Liberal Democrats | Swing | +12.8 | |||
Of the 117 rejected ballots:
Party | Candidate | Votes | % | ±% | |
---|---|---|---|---|---|
Labour | Jo Stevens [29] | 25,193 | 62.4 | +22.4 | |
Conservative | Gregory Stafford | 7,997 | 19.8 | +5.1 | |
Liberal Democrats | Eluned Parrott [30] | 5,415 | 13.4 | -13.7 | |
Plaid Cymru | Mark Hooper | 999 | 2.5 | -2.5 | |
Green | Benjamin Smith | 420 | 1.0 | -5.4 | |
UKIP | Mohammed Sarul-Islam | 343 | 0.8 | -5.7 | |
Rejected ballots | 80 | ||||
Majority | 17,196 | 42.6 | +29.7 | ||
Turnout | 40,367 | 68.1 | +0.8 | ||
Registered electors | 59,288 | ||||
Labour hold | Swing | +8.6 | |||
Of the 80 rejected ballots:
Party | Candidate | Votes | % | ±% | |
---|---|---|---|---|---|
Labour | Jo Stevens | 25,605 | 61.2 | −1.2 | |
Conservative | Meirion Jenkins | 8,426 | 20.1 | +0.3 | |
Liberal Democrats | Bablin Molik | 6,298 | 15.1 | +1.7 | |
Brexit Party | Gareth Pearce | 1,006 | 2.4 | N/A | |
Gwlad Gwlad | Siân Caiach | 280 | 0.7 | N/A | |
Independent | Akil Kata | 119 | 0.3 | N/A | |
Socialist (GB) | Brian Johnson | 88 | 0.2 | N/A | |
Rejected ballots | 204 | ||||
Majority | 17,179 | 41.1 | -1.5 | ||
Turnout | 41,822 | 65.3 | -2.8 | ||
Registered electors | 64,037 | ||||
Labour hold | Swing | -0.8 | |||
Of the 204 rejected ballots:
Islington South and Finsbury is a constituency created in 1974 and represented in the House of Commons of the UK Parliament since 2005 by Emily Thornberry of the Labour Party. Thornberry served as Shadow Foreign Secretary from 2016 until 2020 and is currently Shadow Attorney General for England and Wales.
Cardiff North is a constituency represented in the House of Commons of the UK Parliament since 2017 by Anna McMorrin of the Labour Party.
Oxford West and Abingdon is a constituency represented in the House of Commons of the UK Parliament since 2017 by Layla Moran, a Liberal Democrat.
South West Surrey is a constituency represented in the House of Commons of the UK Parliament. Since 2005, the seat has been represented by Conservative MP Jeremy Hunt, the current chancellor of the Exchequer and the former Culture Secretary, Health Secretary and Foreign Secretary.
Newbury is a constituency represented in the House of Commons of the UK Parliament from 2019 by Laura Farris, a Conservative. It was created by the Redistribution of Seats Act 1885 and has been in continual existence since then.
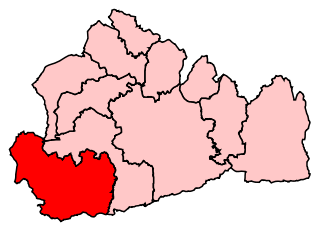
Ashfield is a constituency represented in the House of Commons of the UK Parliament by Lee Anderson, formerly of the Conservative Party, but who had the whip suspended in February 2024 and two weeks later joined Reform UK to become their first MP. The constituency is in the English county of Nottinghamshire, East Midlands; located to the north west of the city of Nottingham in the Erewash Valley along the border with neighbouring county Derbyshire. Ashfield was part of the Red Wall which by and large, voted Conservative in the 2019 general election. In the 2016 referendum on membership of the European Union, Ashfield voted 70% in favour of Brexit.
Blaenau Gwent is a constituency in South Wales, represented in the House of Commons of the UK Parliament since 2010 by Nick Smith of the Labour Party.
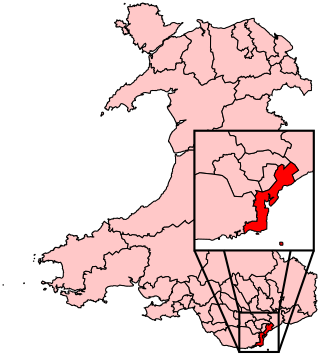
Brecon and Radnorshire is a county constituency in Wales of the House of Commons of the Parliament of the United Kingdom. Created in 1918, it elects one Member of Parliament (MP) by the first-past-the-post system of election. The constituency is represented by Fay Jones of the Conservative Party, who defeated incumbent Jane Dodds of the Liberal Democrats at the 2019 general election.
Bridgend is a constituency represented in the House of Commons of the UK Parliament since 2019 by Jamie Wallis, a Conservative.
Cardiff South and Penarth is a constituency created in 1983 represented in the House of Commons of the UK Parliament since 2012 by Stephen Doughty, a Labour Co-op MP. It is the largest such entity in Wales, with an electorate of 75,175 and one of the most ethnically diverse.
Cardiff West is a constituency represented in the House of Commons of the UK Parliament since 2001 by Kevin Brennan of the Labour Party.
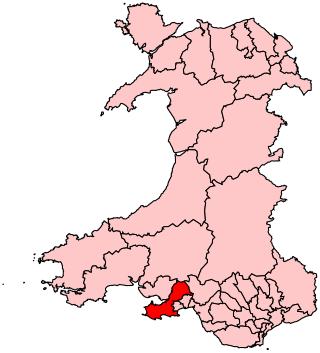
Gower is a constituency created in 1885 and represented in the House of Commons of the UK Parliament by one Member of Parliament (MP). Tonia Antoniazzi of the Labour Party became its MP after winning it from Conservative Byron Davies in the 2017 UK general election. Her party had previously represented the seat from 1909 until 2015.
Montgomeryshire is a constituency in Wales represented in the House of Commons of the UK Parliament.
Ogmore is a constituency created in 1918 represented in the House of Commons of the UK Parliament by Chris Elmore of the Labour Party.
Rhondda is a constituency in Wales represented in the House of Commons of the UK Parliament since 2001 by Chris Bryant of the Labour Party.
Vale of Glamorgan is a constituency represented in the House of Commons of the UK Parliament since 2010 by Alun Cairns, a Conservative.
Southport is a constituency in Merseyside which has been represented in the House of Commons of the UK Parliament since 2017 by Damien Moore of the Conservative Party.
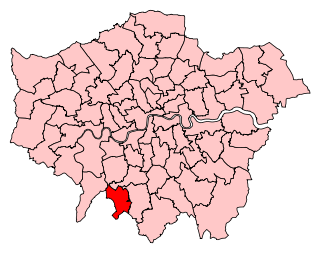
Sutton and Cheam is a constituency in Greater London represented in the House of Commons of the UK Parliament since 2015 by Paul Scully, a Conservative.
Chesham and Amersham is a parliamentary constituency in Buckinghamshire, South East England, represented in the House of Commons by Sarah Green, a Liberal Democrat elected at a 2021 by-election.
Crawley is a constituency in West Sussex represented in the House of Commons of the UK Parliament since 2010 by Henry Smith of the Conservative Party.