Causal map

Last updated
Part of a causal map showing how Factor B causally influences Factor C Causal Map.png
Part of a causal map showing how Factor B causally influences Factor C

A causal map can be defined as a network consisting of links or arcs between nodes or factors, such that a link between C and E means, in some sense, that someone believes or claims C has or had some causal influence on E.

Contents

This definition could cover diagrams representing causal connections between variables which are measured in a strictly quantitative way and would therefore also include closely related statistical models like Structural Equation Models [1] and Directed Acyclic Graphs (DAGs). [2] However the phrase “causal map” is usually reserved for qualitative or merely semi-quantitative maps. In this sense, causal maps can be seen as a type of concept map. Systems diagrams and Fuzzy Cognitive Maps [3] also fall under this definition. Causal maps have been used since the 1970’s by researchers and practitioners in a range of disciplines from management science [4] to ecology, [5]   employing a variety of methods. They are used for many purposes, for example:

Different kinds of causal maps can be distinguished particularly by the kind of information which can be encoded by the links and nodes. One important distinction is to what extent the links are intended to encode causation or (somebody’s) belief about causation.

Causal mapping

Causal mapping is the process of constructing, summarising and drawing inferences from a causal map, and more broadly can refer to sets of techniques for doing this. While one group of such methods is actually called “causal mapping”, there are many similar methods which go by a wide variety of names.

The phrase “causal mapping” goes back at least to Robert Axelrod, [7] based in turn on Kelly’s personal construct theory . [14] The idea of wanting to understand the behaviour of actors in terms of internal ‘maps’ of the word which they carry around with them goes back further, to Kurt Lewin [15] and the field theorists. [16] Causal mapping in this sense is loosely based on "concept mapping" and “cognitive mapping”, and sometimes the three terms are used interchangeably, though the latter two are usually understood to be broader, including maps in which the links between factors are not necessarily causal and are therefore not causal maps.

Literature on the theory and practice of causal mapping includes a few canonical works [7] as well as book-length interdisciplinary overviews, [17] [18] and guides to particular approaches. [19]

Cause–effect graph

In software testing, a cause–effect graph is a directed graph that maps a set of causes to a set of effects. The causes may be thought of as the input to the program, and the effects may be thought of as the output. Usually the graph shows the nodes representing the causes on the left side and the nodes representing the effects on the right side. There may be intermediate nodes in between that combine inputs using logical operators such as AND and OR.

Constraints may be added to the causes and effects. These are represented as edges labeled with the constraint symbol using a dashed line. For causes, valid constraint symbols are E (exclusive), O (one and only one), I (at least one), and R (Requires). The exclusive constraint states that at most one of the causes 1 and 2 can be true, i.e. both cannot be true simultaneously. The Inclusive (at least one) constraint states that at least one of the causes 1, 2 or 3 must be true, i.e. all cannot be false simultaneously. The one and only one (OaOO or simply O) constraint states that only one of the causes 1, 2 or 3 must be true. The Requires constraint states that if cause 1 is true, then cause 2 must be true, and it is impossible for 1 to be true and 2 to be false.

For effects, valid constraint symbol is M (Mask). The mask constraint states that if effect 1 is true then effect 2 is false. Note that the mask constraint relates to the effects and not the causes like the other constraints.

The graph's direction is as follows:

Causes --> intermediate nodes --> Effects

The graph can always be rearranged so there is only one node between any input and any output. See conjunctive normal form and disjunctive normal form.

A cause–effect graph is useful for generating a reduced decision table.

See also

List of Causal Mapping Software

Related Research Articles

<span class="mw-page-title-main">Graph theory</span> Area of discrete mathematics

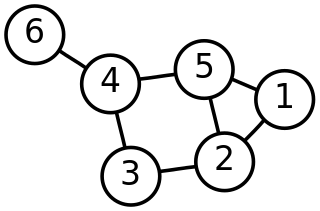
In mathematics, graph theory is the study of graphs, which are mathematical structures used to model pairwise relations between objects. A graph in this context is made up of vertices which are connected by edges. A distinction is made between undirected graphs, where edges link two vertices symmetrically, and directed graphs, where edges link two vertices asymmetrically. Graphs are one of the principal objects of study in discrete mathematics.

<span class="mw-page-title-main">Mind map</span> Diagram to visually organize information

A mind map is a diagram used to visually organize information into a hierarchy, showing relationships among pieces of the whole. It is often created around a single concept, drawn as an image in the center of a blank page, to which associated representations of ideas such as images, words and parts of words are added. Major ideas are connected directly to the central concept, and other ideas branch out from those major ideas.

<span class="mw-page-title-main">Semantic network</span> Knowledge base that represents semantic relations between concepts in a network

A semantic network, or frame network is a knowledge base that represents semantic relations between concepts in a network. This is often used as a form of knowledge representation. It is a directed or undirected graph consisting of vertices, which represent concepts, and edges, which represent semantic relations between concepts, mapping or connecting semantic fields. A semantic network may be instantiated as, for example, a graph database or a concept map. Typical standardized semantic networks are expressed as semantic triples.

Causality (also called causation, or cause and effect) is influence by which one event, process, state, or object (acause) contributes to the production of another event, process, state, or object (an effect) where the cause is partly responsible for the effect, and the effect is partly dependent on the cause. In general, a process has many causes, which are also said to be causal factors for it, and all lie in its past. An effect can in turn be a cause of, or causal factor for, many other effects, which all lie in its future. Some writers have held that causality is metaphysically prior to notions of time and space.

A Bayesian network is a probabilistic graphical model that represents a set of variables and their conditional dependencies via a directed acyclic graph (DAG). It is one of several forms of causal notation. Bayesian networks are ideal for taking an event that occurred and predicting the likelihood that any one of several possible known causes was the contributing factor. For example, a Bayesian network could represent the probabilistic relationships between diseases and symptoms. Given symptoms, the network can be used to compute the probabilities of the presence of various diseases.

The thinking processes in Eliyahu M. Goldratt's theory of constraints are the five methods to enable the focused improvement of any cognitive system.

<span class="mw-page-title-main">Conceptual graph</span>

A conceptual graph (CG) is a formalism for knowledge representation. In the first published paper on CGs, John F. Sowa used them to represent the conceptual schemas used in database systems. The first book on CGs applied them to a wide range of topics in artificial intelligence, computer science, and cognitive science.

A diagram is a symbolic representation of information using visualization techniques. Diagrams have been used since prehistoric times on walls of caves, but became more prevalent during the Enlightenment. Sometimes, the technique uses a three-dimensional visualization which is then projected onto a two-dimensional surface. The word graph is sometimes used as a synonym for diagram.

<span class="mw-page-title-main">Concept map</span> Diagram showing relationships among concepts

A concept map or conceptual diagram is a diagram that depicts suggested relationships between concepts. Concept maps may be used by instructional designers, engineers, technical writers, and others to organize and structure knowledge.

The Markov condition, sometimes called the Markov assumption, is an assumption made in Bayesian probability theory, that every node in a Bayesian network is conditionally independent of its nondescendants, given its parents. Stated loosely, it is assumed that a node has no bearing on nodes which do not descend from it. In a DAG, this local Markov condition is equivalent to the global Markov condition, which states that d-separations in the graph also correspond to conditional independence relations. This also means that a node is conditionally independent of the entire network, given its Markov blanket.

<span class="mw-page-title-main">Spatial network</span> Network representing spatial objects

A spatial network is a graph in which the vertices or edges are spatial elements associated with geometric objects, i.e., the nodes are located in a space equipped with a certain metric. The simplest mathematical realization of spatial network is a lattice or a random geometric graph, where nodes are distributed uniformly at random over a two-dimensional plane; a pair of nodes are connected if the Euclidean distance is smaller than a given neighborhood radius. Transportation and mobility networks, Internet, mobile phone networks, power grids, social and contact networks and biological neural networks are all examples where the underlying space is relevant and where the graph's topology alone does not contain all the information. Characterizing and understanding the structure, resilience and the evolution of spatial networks is crucial for many different fields ranging from urbanism to epidemiology.

<span class="mw-page-title-main">Structural equation modeling</span> Form of causal modeling that fit networks of constructs to data

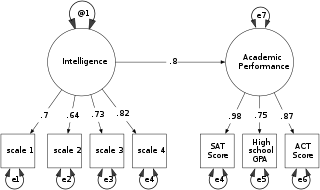
Structural equation modeling (SEM) is a diverse set of methods used by scientists doing both observational and experimental research. SEM is used mostly in the social and behavioral sciences but it is also used in epidemiology, business, and other fields. A definition of SEM is difficult without reference to technical language, but a good starting place is the name itself.

<span class="mw-page-title-main">Causal loop diagram</span> Causal diagram that aids in visualizing how different variables in a system are interrelated

A causal loop diagram (CLD) is a causal diagram that aids in visualizing how different variables in a system are causally interrelated. The diagram consists of a set of words and arrows. Causal loop diagrams are accompanied by a narrative which describes the causally closed situation the CLD describes. Closed loops, or causal feedback loops, in the diagram are very important features of CLDs.

<span class="mw-page-title-main">Causal model</span> Conceptual model in philosophy of science

In the philosophy of science, a causal model is a conceptual model that describes the causal mechanisms of a system. Several types of causal notation may be used in the development of a causal model. Causal models can improve study designs by providing clear rules for deciding which independent variables need to be included/controlled for.

Why–because analysis (WBA) is a method for accident analysis. It is independent of application domain and has been used to analyse, among others, aviation-, railway-, marine-, and computer-related accidents and incidents. It is mainly used as an after-the-fact analysis method. WBA strives to ensure objectivity, falsifiability and reproducibility of results.

<span class="mw-page-title-main">Diagrammatic reasoning</span>

Diagrammatic reasoning is reasoning by means of visual representations. The study of diagrammatic reasoning is about the understanding of concepts and ideas, visualized with the use of diagrams and imagery instead of by linguistic or algebraic means.

<span class="mw-page-title-main">Fuzzy cognitive map</span>

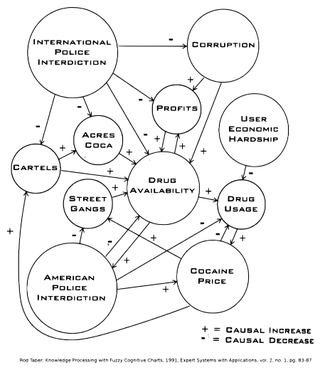
A fuzzy cognitive map (FCM) is a cognitive map within which the relations between the elements of a "mental landscape" can be used to compute the "strength of impact" of these elements. Fuzzy cognitive maps were introduced by Bart Kosko. Robert Axelrod introduced cognitive maps as a formal way of representing social scientific knowledge and modeling decision making in social and political systems, then brought in the computation.

A signal-flow graph or signal-flowgraph (SFG), invented by Claude Shannon, but often called a Mason graph after Samuel Jefferson Mason who coined the term, is a specialized flow graph, a directed graph in which nodes represent system variables, and branches represent functional connections between pairs of nodes. Thus, signal-flow graph theory builds on that of directed graphs, which includes as well that of oriented graphs. This mathematical theory of digraphs exists, of course, quite apart from its applications.

Causal reasoning is the process of identifying causality: the relationship between a cause and its effect. The study of causality extends from ancient philosophy to contemporary neuropsychology; assumptions about the nature of causality may be shown to be functions of a previous event preceding a later one. The first known protoscientific study of cause and effect occurred in Aristotle's Physics. Causal inference is an example of causal reasoning.

Node graph architecture is a software design structured around the notion of a node graph. Both the source code as well as the user interface is designed around the editing and composition of atomic functional units.

References

  1. Clogg, Clifford C.; Bollen, Kenneth A.; Long, J. Scott (1993). "Testing Structural Equation Models". Social Forces. 73 (3): 1161. doi:10.2307/2580595. ISSN   0037-7732. JSTOR   2580595.
  2. Pearl, J; Mackenzie, D (2018). "The Book of Why: The New Science of Cause and Effect". Journal of the American Statistical Association. 115 (529): 482–485. arXiv: 2003.11635 . doi:10.1080/01621459.2020.1721245. ISSN   0162-1459. S2CID   213366968.
  3. Kosko, 1986
  4. Bougon, Michel; Weick, Karl; Binkhorst, Din (1977). "Cognition in Organizations: An Analysis of the Utrecht Jazz Orchestra". Administrative Science Quarterly. 22 (4): 606. doi:10.2307/2392403. ISSN   0001-8392. JSTOR   2392403.
  5. Moon, Katie; Guerrero, Angela M.; Adams, Vanessa. M.; Biggs, Duan; Blackman, Deborah A.; Craven, Luke; Dickinson, Helen; Ross, Helen (2019-03-07). "Mental models for conservation research and practice". Conservation Letters. 12 (3). doi: 10.1111/conl.12642 . ISSN   1755-263X.
  6. Alan., Murray, Charles. Investment and tithing in Thai villages: a behavioral study of rural modernization. OCLC   24819834.{{cite book}}: CS1 maint: multiple names: authors list (link)
  7. 1 2 3 Robert, Axelrod (1976). Structure of Decision : the Cognitive Maps of Political Elites. Princeton University Press. ISBN   978-1-4008-7195-7. OCLC   949946348.
  8. Reynolds, Martin; Holwell, Sue, eds. (2010). Systems Approaches to Managing Change: A Practical Guide. Bibcode:2010satm.book.....R. doi:10.1007/978-1-84882-809-4. ISBN   978-1-84882-808-7.
  9. Barbrook-Johnson, Pete; Penn, Alexandra (2021). "Participatory systems mapping for complex energy policy evaluation". Evaluation. 27 (1): 57–79. doi: 10.1177/1356389020976153 . ISSN   1356-3890. S2CID   231624497.
  10. Laukkanen, Mauri; Wang, Mingde (2016-03-03). Comparative Causal Mapping. doi:10.4324/9781315573038. ISBN   9781315573038.
  11. Copestake, J; Remnant, F (2019). "Generating credible evidence of social impact using the Qualitative Impact Protocol (QuIP): the challenge of positionality in data coding and analysis".{{cite journal}}: Cite journal requires |journal= (help)
  12. Davies, Rick (2004). "Scale, Complexity and the Representation of Theories of Change". Evaluation. 10 (1): 101–121. doi:10.1177/1356389004043124. ISSN   1356-3890. S2CID   62169076.
  13. Huey-Tsyh., Chen (1990). Theory-driven evaluations. Sage Publications. ISBN   0-8039-3532-3. OCLC   611218200.
  14. Kelly, G (1955). "Beneath the mask. An introduction to theories of personality". Personality and Individual Differences. 2 (4): 356. doi:10.1016/0191-8869(81)90099-4. ISSN   0191-8869.
  15. Lewin, K. (1982). Force field analysis
  16. Tolman, E. C. (1948). Cognitive maps in rats and men. Psychological Review, 55(4), 189.
  17. Huff, A.S (1990). "Mapping strategic thought". Long Range Planning. 24 (2): 123. doi:10.1016/0024-6301(91)90132-8. ISSN   0024-6301.
  18. Narayanan, V.K.; Armstrong, Deborah J., eds. (2005). Causal Mapping for Research in Information Technology. IGI Global. doi:10.4018/978-1-59140-396-8. ISBN   978-1-59140-396-8.
  19. Powell, S; Remnant, F; Avard, R; Goddard, S (2021). "Guide to Causal Mapping".

Further reading