
Climate is the long-term weather pattern in a region, typically averaged over 30 years. More rigorously, it is the mean and variability of meteorological variables over a time spanning from months to millions of years. Some of the meteorological variables that are commonly measured are temperature, humidity, atmospheric pressure, wind, and precipitation. In a broader sense, climate is the state of the components of the climate system, including the atmosphere, hydrosphere, cryosphere, lithosphere and biosphere and the interactions between them. The climate of a location is affected by its latitude, longitude, terrain, altitude, land use and nearby water bodies and their currents.

Climatology or climate science is the scientific study of Earth's climate, typically defined as weather conditions averaged over a period of at least 30 years. Climate concerns the atmospheric condition during an extended to indefinite period of time; weather is the condition of the atmosphere during a relative brief period of time. The main topics of research are the study of climate variability, mechanisms of climate changes and modern climate change. This topic of study is regarded as part of the atmospheric sciences and a subdivision of physical geography, which is one of the Earth sciences. Climatology includes some aspects of oceanography and biogeochemistry.
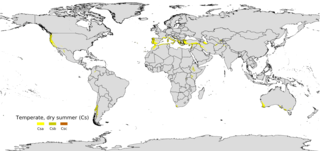
A Mediterranean climate, also called a dry summer climate, described by Köppen as Cs, is a temperate climate type that occurs in the lower mid-latitudes. Such climates typically have dry summers and wet winters, with summer conditions ranging from warm to hot and winter conditions typically being mild to cool. These weather conditions are typically experienced in the majority of Mediterranean-climate regions and countries, but remain highly dependent on proximity to the ocean, altitude and geographical location.

climateprediction.net (CPDN) is a volunteer computing project to investigate and reduce uncertainties in climate modelling. It aims to do this by running hundreds of thousands of different models using the donated idle time of ordinary personal computers, thereby leading to a better understanding of how models are affected by small changes in the many parameters known to influence the global climate.
The climate of Salt Lake City, Utah features cold and snowy winters, hot and dry summers, and modest to light seasonal rainfall. Lying in the Salt Lake Valley, the city is surrounded by mountains and the Great Salt Lake. Under the Köppen climate classification, Salt Lake City has either a Mediterranean climate (Csa) or dry-summer continental climate (Dsa) depending on which variant of the system is used, though it borders on a cold semi-arid climate (BSk) due to the city's relatively low precipitation.

Kuujjuarapik is the southernmost northern village at the mouth of the Great Whale River on the coast of Hudson Bay in Nunavik, Quebec, Canada. Almost 1000 people, mostly Cree, live in the adjacent village of Whapmagoostui. The community is only accessible by air, Kuujjuarapik Airport and, in late summer, by boat. The nearest Inuit village is Umiujaq, about 160 km (99 mi) north-northeast of Kuujjuarapik. The police services in Kuujjuaraapik are provided by the Nunavik Police Service, formerly the Kativik Regional Police Force. Like most other northern villages in Quebec, there is an Inuit reserved land of the same name, Kuujjuarapik. However, unlike most other Inuit reserved lands, the Inuit reserved land of Kuujjuarapik is not adjacent to its eponymous northern village; rather, it is located considerably farther north and in fact borders on the Inuit reserved land of Umiujaq.

A heat map is a 2-dimensional data visualization technique that represents the magnitude of individual values within a dataset as a color. The variation in color may be by hue or intensity.

A thematic map is a type of map that portrays the geographic pattern of a particular subject matter (theme) in a geographic area. This usually involves the use of map symbols to visualize selected properties of geographic features that are not naturally visible, such as temperature, language, or population. In this, they contrast with general reference maps, which focus on the location of a diverse set of physical features, such as rivers, roads, and buildings. Alternative names have been suggested for this class, such as special-subject or special-purpose maps, statistical maps, or distribution maps, but these have generally fallen out of common usage. Thematic mapping is closely allied with the field of Geovisualization.
Upper-atmospheric models are simulations of the Earth's atmosphere between 20 and 100 km that comprises the stratosphere, mesosphere, and the lower thermosphere. Whereas most climate models simulate a region of the Earth's atmosphere from the surface to the stratopause, there also exist numerical models which simulate the wind, temperature and composition of the Earth's tenuous upper atmosphere, from the mesosphere to the exosphere, including the ionosphere. This region is affected strongly by the 11 year Solar cycle through variations in solar UV/EUV/Xray radiation and solar wind leading to high latitude particle precipitation and aurora. It has been proposed that these phenomena may have an effect on the lower atmosphere, and should therefore be included in simulations of climate change. For this reason there has been a drive in recent years to create whole atmosphere models to investigate whether or not this is the case.
The Winkler Index, sometimes known as the Winkler Scale or WinklerRegions, is a technique for classifying the climate of wine growing regions based on heat summation or growing degree-days. In the system, geographical areas are divided into five climate regions based on temperature converted to growing degree-days, and is commonly known as Regions I–V. The system was developed at the University of California, Davis by A. J. Winkler and Maynard Amerine.
The climate of San Diego, California is classified as a hot-summer Mediterranean climate. The basic climate features hot, sunny, and dry summers, and cooler, wetter winters. However, San Diego is much more arid than typical Mediterranean climates, and winters are still dry compared with most other zones with this type of climate. The climate at San Diego International Airport, the location for official weather reports for San Diego, as well as the climate at most beach areas, straddles the border between BSh and BSk due to the mild winters and cool summers in these locations.
In business intelligence, location intelligence (LI), or spatial intelligence, is the process of deriving meaningful insight from geospatial data relationships to solve a particular problem. It involves layering multiple data sets spatially and/or chronologically, for easy reference on a map, and its applications span industries, categories and organizations.

North Dakota's climate is typical of a continental climate with cold winters and warm-hot summers. The state's location in the Upper Midwest allows it to experience some of the widest variety of weather in the United States, and each of the four seasons has its own distinct characteristics. The eastern half of the state has a humid continental climate with warm to hot, somewhat humid summers and cold, windy winters, while the western half has a semi-arid climate with less precipitation and less humidity but similar temperature profiles. The areas east of the Missouri River get slightly colder winters, while those west of the stream get higher summer daytime temperatures. In general, the diurnal temperature difference is prone to be more significant in the west due to higher elevation and less humidity.
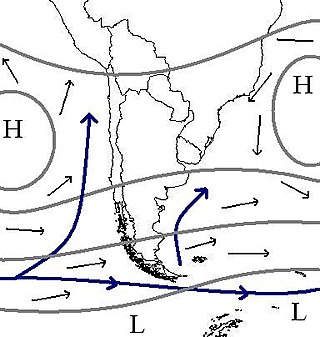
The climate of Chile comprises a wide range of weather conditions across a large geographic scale, extending across 38 degrees in latitude, making generalizations difficult. According to the Köppen system, Chile within its borders hosts at least seven major climatic subtypes, ranging from low desert in the north, to alpine tundra and glaciers in the east and southeast, tropical rainforest in Easter Island, Oceanic in the south and Mediterranean climate in central Chile. There are four seasons in most of the country: summer, autumn, winter, and spring.
Ambararata is a town and commune in Madagascar. It belongs to the district of Befandriana-Nord, which is a part of Sofia Region. The population of the commune was estimated to be approximately 13,000 in 2001 commune census.

The climate of New York (state) is generally humid continental, while the extreme southeastern portion of the state lies in the warmer humid subtropical climate zone. Winter temperatures average below freezing during January and February in much of the state of New York, but several degrees above freezing along the Atlantic coastline, including New York City.

Kosovo is a relatively small country. Because of the climatic position and complicated structure of the relief it has a variety of climate systems.
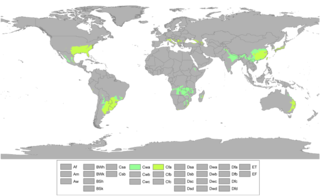
A humid subtropical climate is a temperate climate type characterized by hot and humid summers, and cool to mild winters. These climates normally lie on the southeast side of all continents, generally between latitudes 25° and 40° and are located poleward from adjacent tropical climates, and equatorward from either humid continental or oceanic climates. It is also known as warm temperate climate in some climate classifications.
Whapmagoostui is a Cree village municipality in the territory of Eeyou Istchee in northern Quebec; it has a distinct legal status and classification from other kinds of village municipalities in Quebec: Naskapi village municipalities, northern villages, and ordinary villages.
Interactive Visual Analysis (IVA) is a set of techniques for combining the computational power of computers with the perceptive and cognitive capabilities of humans, in order to extract knowledge from large and complex datasets. The techniques rely heavily on user interaction and the human visual system, and exist in the intersection between visual analytics and big data. It is a branch of data visualization. IVA is a suitable technique for analyzing high-dimensional data that has a large number of data points, where simple graphing and non-interactive techniques give an insufficient understanding of the information.
