A statistical hypothesis test is a method of statistical inference used to decide whether the data at hand sufficiently support a particular hypothesis. Hypothesis testing allows us to make probabilistic statements about population parameters.
Nonparametric statistics is the branch of statistics that is not based solely on parametrized families of probability distributions. Nonparametric statistics is based on either being distribution-free or having a specified distribution but with the distribution's parameters unspecified. Nonparametric statistics includes both descriptive statistics and statistical inference. Nonparametric tests are often used when the assumptions of parametric tests are violated.
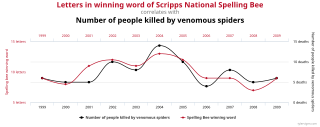
In statistics, hypotheses suggested by a given dataset, when tested with the same dataset that suggested them, are likely to be accepted even when they are not true. This is because circular reasoning would be involved: something seems true in the limited data set; therefore we hypothesize that it is true in general; therefore we wrongly test it on the same, limited data set, which seems to confirm that it is true. Generating hypotheses based on data already observed, in the absence of testing them on new data, is referred to as post hoc theorizing.
In psychometrics, item response theory (IRT) is a paradigm for the design, analysis, and scoring of tests, questionnaires, and similar instruments measuring abilities, attitudes, or other variables. It is a theory of testing based on the relationship between individuals' performances on a test item and the test takers' levels of performance on an overall measure of the ability that item was designed to measure. Several different statistical models are used to represent both item and test taker characteristics. Unlike simpler alternatives for creating scales and evaluating questionnaire responses, it does not assume that each item is equally difficult. This distinguishes IRT from, for instance, Likert scaling, in which "All items are assumed to be replications of each other or in other words items are considered to be parallel instruments" (p. 197). By contrast, item response theory treats the difficulty of each item as information to be incorporated in scaling items.
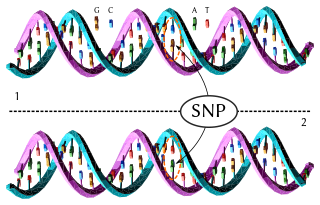
A haplotype is a group of alleles in an organism that are inherited together from a single parent.
The general linear model or general multivariate regression model is a compact way of simultaneously writing several multiple linear regression models. In that sense it is not a separate statistical linear model. The various multiple linear regression models may be compactly written as
Linear discriminant analysis (LDA), normal discriminant analysis (NDA), or discriminant function analysis is a generalization of Fisher's linear discriminant, a method used in statistics and other fields, to find a linear combination of features that characterizes or separates two or more classes of objects or events. The resulting combination may be used as a linear classifier, or, more commonly, for dimensionality reduction before later classification.
The Friedman test is a non-parametric statistical test developed by Milton Friedman. Similar to the parametric repeated measures ANOVA, it is used to detect differences in treatments across multiple test attempts. The procedure involves ranking each row together, then considering the values of ranks by columns. Applicable to complete block designs, it is thus a special case of the Durbin test.
In statistics, a latent class model (LCM) relates a set of observed multivariate variables to a set of latent variables. It is a type of latent variable model. It is called a latent class model because the latent variable is discrete. A class is characterized by a pattern of conditional probabilities that indicate the chance that variables take on certain values.
In statistics, family-wise error rate (FWER) is the probability of making one or more false discoveries, or type I errors when performing multiple hypotheses tests.
Chi-square automatic interaction detection (CHAID) is a decision tree technique based on adjusted significance testing. The technique was developed in South Africa and was published in 1980 by Gordon V. Kass, who had completed a PhD thesis on this topic. CHAID can be used for prediction as well as classification, and for detection of interaction between variables. CHAID is based on a formal extension of AID and THAID procedures of the 1960s and 1970s, which in turn were extensions of earlier research, including that performed by Belson in the UK in the 1950s. A history of earlier supervised tree methods, a detailed description of the original CHAID algorithm and the exhaustive CHAID extension by Biggs, De Ville, and Suen, is described by Gilbert.
In statistics, the Bonferroni correction is a method to counteract the multiple comparisons problem. Bonferroni correction is the simplest method for counteracting this; however, it is a conservative method that gives greater risk of failure to reject a false null hypothesis than other methods, as it ignores potentially valuable information, such as the distribution of p-values across all comparisons.
In statistics, the multiple comparisons, multiplicity or multiple testing problem occurs when one considers a set of statistical inferences simultaneously or infers a subset of parameters selected based on the observed values.
In statistics, the Holm–Bonferroni method, also called the Holm method or Bonferroni–Holm method, is used to counteract the problem of multiple comparisons. It is intended to control the family-wise error rate and offers a simple test uniformly more powerful than the Bonferroni correction. It is named after Sture Holm, who codified the method, and Carlo Emilio Bonferroni.
Item tree analysis (ITA) is a data analytical method which allows constructing a hierarchical structure on the items of a questionnaire or test from observed response patterns.
Assume that we have a questionnaire with m items and that subjects can answer positive (1) or negative (0) to each of these items, i.e. the items are dichotomous. If n subjects answer the items this results in a binary data matrix D with m columns and n rows. Typical examples of this data format are test items which can be solved (1) or failed (0) by subjects. Other typical examples are questionnaires where the items are statements to which subjects can agree (1) or disagree (0).
Depending on the content of the items it is possible that the response of a subject to an item j determines her or his responses to other items. It is, for example, possible that each subject who agrees to item j will also agree to item i. In this case we say that item j implies item i. The goal of an ITA is to uncover such deterministic implications from the data set D.
In statistics, qualitative comparative analysis (QCA) is a data analysis based on set theory to examine the relationship of conditions to outcome. QCA describes the relationship in terms of necessary conditions and sufficient conditions. The technique was originally developed by Charles Ragin in 1987 to study data sets that are too small for linear regression analysis but large for cross-case analysis.

Mark Stemmler was born on August 7, 1960 in Norwood, Massachusetts, United States. He was Professor of Psychological Methodology and Quality Assurance at the Faculty of Psychology and Sports Science, Bielefeld University from 2007 to 2011. He was also a member of the Center for Statistics at Bielefeld University. Currently he is Professor of Psychological Assessment at the Department of Psychology and Sports Science at the University of Erlangen-Nuremberg. Since 2010 he is also Adjunct Professor at the College of Health and Human Development at the Pennsylvania State University.

Anton K. Formann was an Austrian research psychologist, statistician, and psychometrician. He is renowned for his contributions to item response theory, latent class analysis, the measurement of change, mixture models, categorical data analysis, and quantitative methods for research synthesis (meta-analysis).
In statistics, a false coverage rate (FCR) is the average rate of false coverage, i.e. not covering the true parameters, among the selected intervals.
Alexander von Eye is a German-American psychologist and former Professor of Methods in Psychology at the University of Vienna in Vienna, Austria. Before joining the University of Vienna in 2012, he taught at Michigan State University, where he served as chair of the Unit of Developmental Psychology from 2003 to 2008. Before joining Michigan State University in 1993, he served as Professor of Human Development and Psychology at Penn State University. He has developed methods for analyzing categorical and longitudinal data in psychology. He is a fellow of the American Psychological Association and the American Psychological Society. As of 2015, he lived in Montpellier, France.

