Crony capitalism, sometimes also called simply cronyism, is a pejorative term used in political discourse to describe a situation in which businesses profit from a close relationship with state power, either through an anti-competitive regulatory environment, direct government largesse, and/or corruption. Examples given for crony capitalism include obtainment of permits, government grants, tax breaks, or other undue influence from businesses over the state's deployment of public goods, for example, mining concessions for primary commodities or contracts for public works. In other words, it is used to describe a situation where businesses thrive not as a result of free enterprise, but rather collusion between a business class and the political class.

Gross domestic product (GDP) is a monetary measure of the market value of all the final goods and services produced in a specific time period by a country or countries. GDP is most often used by the government of a single country to measure its economic health. Due to its complex and subjective nature, this measure is often revised before being considered a reliable indicator.

Per capita income (PCI) or average income measures the average income earned per person in a given area in a specified year.

The economy of Russia has gradually transformed from a planned economy into a mixed market-oriented economy. It has enormous natural resources, particularly oil and natural gas. In 2023, it was the world's 11th-largest economy by nominal GDP, 6th-largest by purchasing power parity (PPP) according to IMF, and 5th-largest according to World Bank. Due to a volatile currency exchange rate, Russia's GDP as measured in dollars fluctuates sharply. Russia was the last major economy to join the WTO, becoming a member in 2012.
The United States is a highly developed/advanced mixed economy. It is the world's largest economy by nominal GDP; it is also the second largest by purchasing power parity (PPP), behind China. It has the world's seventh highest per capita GDP (nominal) and the eighth highest per capita GDP (PPP) as of 2022. The U.S. accounted for 25.4% of the global economy in 2022 in nominal terms, and about 15.6% in PPP terms. The U.S. dollar is the currency of record most used in international transactions and is the world's reserve currency, backed by a large U.S. treasuries market, its role as the reference standard for the petrodollar system, and its linked eurodollar. Several countries use it as their official currency and in others it is the de facto currency.

In economics, income distribution covers how a country's total GDP is distributed amongst its population. Economic theory and economic policy have long seen income and its distribution as a central concern. Unequal distribution of income causes economic inequality which is a concern in almost all countries around the world.

The economy of Asia comprises about 4.7 billion people living in 50 different nations. Asia is the fastest growing economic region, as well as the largest continental economy by both GDP Nominal and PPP in the world. Moreover, Asia is the site of some of the world's longest modern economic booms.
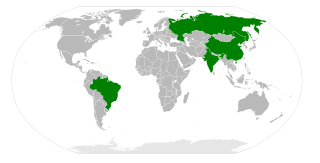
BRIC is a term describing the foreign investment strategies grouping acronym that stands for Brazil, Russia, India, and China. The separate BRICS organisation would go on to become a political and economic organization largely based on such grouping.

The economy of India has transitioned from a mixed planned economy to a mixed middle-income developing social market economy with notable public sector in strategic sectors. It is the world's fifth-largest economy by nominal GDP and the third-largest by purchasing power parity (PPP); on a per capita income basis, India ranked 139th by GDP (nominal) and 127th by GDP (PPP). From independence in 1947 until 1991, successive governments followed Soviet model and promoted protectionist economic policies, with extensive Sovietization, state intervention, demand-side economics, natural resources, bureaucrat driven enterprises and economic regulation. This is characterised as dirigism, in the form of the Licence Raj. The end of the Cold War and an acute balance of payments crisis in 1991 led to the adoption of a broad economic liberalisation in India and indicative planning. Since the start of the 21st century, annual average GDP growth has been 6% to 7%. The economy of the Indian subcontinent was the largest in the world for most of recorded history up until the onset of colonialism in early 19th century.

The term "Hindu rate of growth" was coined by the Indian economist Raj Krishna in 1978. It refers to the annual growth rate of India's economy before the economic reforms of 1991, which averaged 4% from the 1950s to the 1980s. Advocates of liberalisation often use this term. However, modern neoliberal economists criticise the term, as they believe that the low growth rate was caused by the failed five-year plan model and economic mismanagement. Many economists worldwide characterise the economic system after the 1990s as Dirigisme. Dirigiste policies often include indicative planning, state-directed investment, and the use of market instruments to incentivize market entities to fulfill state economic objectives.Eighth Five Year Plan was for managing the transition from a centrally planned economy to market led economy through indicative planning.

Corruption in India is an issue which affects economy of central, state, and local government agencies. Corruption is blamed for stunting the economy of India. A study conducted by Transparency International in 2005 recorded that more than 62% of Indians had at some point or another paid a bribe to a public official to get a job done. In 2008, another report showed that about 50% of Indians had first hand experience of paying bribes or using contacts to get services performed by public offices. In Transparency International's 2023 Corruption Perceptions Index, which scored 180 countries on a scale from 0 to 100, India scored 39. When ranked by score, India ranked 93rd among the 180 countries in the Index, where the country ranked first is perceived to have the most honest public sector. For comparison with worldwide scores, the best score was 90, the worst score was 11, and the average score was 43. For comparison with regional scores, the highest score among the countries of the Asia Pacific region was 85, the lowest score was 17, and the average score was 45. Various factors contribute to corruption, including officials siphoning money from government social welfare schemes. Examples include the Mahatma Gandhi National Rural Employment Guarantee Act and the National Rural Health Mission. Other areas of corruption include India's trucking industry, which is forced to pay billions of rupees in bribes annually to numerous regulatory and police stops on interstate highways.

China has an upper middle income, developing, mixed, socialist market economy incorporating industrial policies and strategic five-year plans. It is the world's second largest economy by nominal GDP, behind the United States, and the world's largest economy since 2016 when measured by purchasing power parity (PPP). Due to a volatile currency exchange rate, China's GDP as measured in dollars fluctuates sharply. China accounted for 19% of the global economy in 2022 in PPP terms, and around 18% in nominal terms in 2022. Historically, China was one of the world's foremost economic powers for most of the two millennia from the 1st until the 19th century. The economy consists of public sector enterprises, state-owned enterprises (SOEs) and mixed-ownership enterprises, as well as a large domestic private sector and openness to foreign businesses in their system. Private investment and exports are the main drivers of economic growth in China, but the Chinese government has also emphasized domestic consumption.

Corruption is perceived as a significant problem in Russia, impacting various aspects of life, including the economy, business, public administration, law enforcement, healthcare, and education. The phenomenon of corruption is strongly established in the historical model of public governance, and attributed to general weakness of rule of law in the country. Transparency International stated in 2022, "Corruption is endemic in Russia" and assigned it the lowest score of any European country in their Corruption Perceptions Index for 2021. It has, under the regime of Vladimir Putin, been variously characterized as a kleptocracy, an oligarchy, and a plutocracy; owing to its crony capitalism economic system.

The Philippines suffers from widespread corruption, which developed during the Spanish colonial period. According to GAN Integrity's Philippines Corruption Report updated May 2020, the Philippines suffers from many incidents of corruption and crime in many aspects of civic life and in various sectors. Such corruption risks are rampant throughout the state's judicial system, police service, public services, land administration, and natural resources.
China's current mainly market economy features a high degree of income inequality. According to the Asian Development Bank Institute, “before China implemented reform and opening-up policies in 1978, its income distribution pattern was characterized as egalitarian in all aspects.”
Income inequality in India refers to the unequal distribution of wealth and income among its citizens. According to the CIA World Factbook, the Gini coefficient of India, which is a measure of income distribution inequality, was 35.2 in 2011, ranking 95th out of 157. Wealth distribution is also uneven, with one report estimating that 54% of the country's wealth is controlled by millionaires, the second highest after Russia, as of November 2016. The richest 1% of Indians own 58% of wealth, while the richest 10% of Indians own 80% of the wealth. This trend has consistently increased, meaning the rich are getting richer much faster than the poor, widening the income gap. Inequality worsened since the establishment of income tax in 1922, overtaking the British Raj's record of the share of the top 1% in national income, which was 20.7% in 1939–40.According to Oxfam India's report of 2023, "Survival of the Richest: India Story," just 5 per cent of Indians own more than 60 per cent of the country’s wealth, while the bottom 50 per cent of the population possess only 3 per cent of the wealth. It also says that between 2012 and 2021, 40% of wealth generated in India has gone to just 1% of the total population and 3% of the wealth has gone to bottom 50%. The number of hungry Indians increased to 350 million in 2022 from 190 million in 2018, while the number of billionaires has increased from 102 in 2020 to 166 in 2022. The covid pandemic reduced the income of the poor, but the wealthy did well. The combined wealth of India's 100 richest is now above $600 billion, which is equivalent to India's Union Budget for 18 months. According to Union Government 's own submission to Supreme Court of India, widespread hunger has caused 65% of deaths of children under the age of 5 in 2022.Saurabh Mukherjee, the founder and CIO of Marcellus Investment Managers, along with his colleague Nandita Rajhansa, has coined the term "Octopus Class" to depict 2 lakh families or around 1 million people in India who control 80% of India's wealth. This class has consolidated financial, social and political power and has continuously pushed its 'tentacles' in every profitable activity they are interested in, aided by liberalisation and consequent growth of globalised economy since 1991.
The middle income trap is an economic development situation in which a country that attains a certain income gets stuck at that level. The term was introduced by the World Bank in 2007 who defined it as the 'middle-income range' countries with gross national product per capita that has remained between $1,000 to $12,000 at constant (2011) prices.
Millennial socialism is a resurgence of interest in democratic socialism and social democracy among Americans and Britons born between 1980 and 1996, generationally known as millennials.
This is an economic history of the 2020s. Economic history refers to the study of economies or economic events of the past, including financial and business history.