Related Research Articles
Discrete mathematics is the study of mathematical structures that can be considered "discrete" rather than "continuous". Objects studied in discrete mathematics include integers, graphs, and statements in logic. By contrast, discrete mathematics excludes topics in "continuous mathematics" such as real numbers, calculus or Euclidean geometry. Discrete objects can often be enumerated by integers; more formally, discrete mathematics has been characterized as the branch of mathematics dealing with countable sets. However, there is no exact definition of the term "discrete mathematics".
An illusion is a distortion of the senses, which can reveal how the mind normally organizes and interprets sensory stimulation. Although illusions distort the human perception of reality, they are generally shared by most people.

In visual perception, an optical illusion is an illusion caused by the visual system and characterized by a visual percept that arguably appears to differ from reality. Illusions come in a wide variety; their categorization is difficult because the underlying cause is often not clear but a classification proposed by Richard Gregory is useful as an orientation. According to that, there are three main classes: physical, physiological, and cognitive illusions, and in each class there are four kinds: Ambiguities, distortions, paradoxes, and fictions. A classical example for a physical distortion would be the apparent bending of a stick half immerged in water; an example for a physiological paradox is the motion aftereffect. An example for a physiological fiction is an afterimage. Three typical cognitive distortions are the Ponzo, Poggendorff, and Müller-Lyer illusion. Physical illusions are caused by the physical environment, e.g. by the optical properties of water. Physiological illusions arise in the eye or the visual pathway, e.g. from the effects of excessive stimulation of a specific receptor type. Cognitive visual illusions are the result of unconscious inferences and are perhaps those most widely known.

Topography is the study of the forms and features of land surfaces. The topography of an area may refer to the land forms and features themselves, or a description or depiction in maps.
Riemannian geometry is the branch of differential geometry that studies Riemannian manifolds, defined as smooth manifolds with a Riemannian metric. This gives, in particular, local notions of angle, length of curves, surface area and volume. From those, some other global quantities can be derived by integrating local contributions.
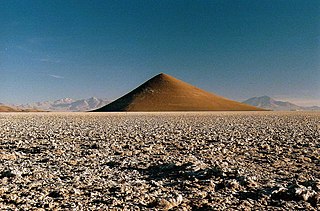
A landform is a natural or anthropogenic land feature on the solid surface of the Earth or other planetary body. Landforms together make up a given terrain, and their arrangement in the landscape is known as topography. Landforms include hills, mountains, canyons, and valleys, as well as shoreline features such as bays, peninsulas, and seas, including submerged features such as mid-ocean ridges, volcanoes, and the great ocean basins.
In mathematics, specifically in differential topology, Morse theory enables one to analyze the topology of a manifold by studying differentiable functions on that manifold. According to the basic insights of Marston Morse, a typical differentiable function on a manifold will reflect the topology quite directly. Morse theory allows one to find CW structures and handle decompositions on manifolds and to obtain substantial information about their homology.
In gauge theory and mathematical physics, a topological quantum field theory is a quantum field theory which computes topological invariants.

Scientific visualization is an interdisciplinary branch of science concerned with the visualization of scientific phenomena. It is also considered a subset of computer graphics, a branch of computer science. The purpose of scientific visualization is to graphically illustrate scientific data to enable scientists to understand, illustrate, and glean insight from their data. Research into how people read and misread various types of visualizations is helping to determine what types and features of visualizations are most understandable and effective in conveying information.
In mathematics, geometric topology is the study of manifolds and maps between them, particularly embeddings of one manifold into another.
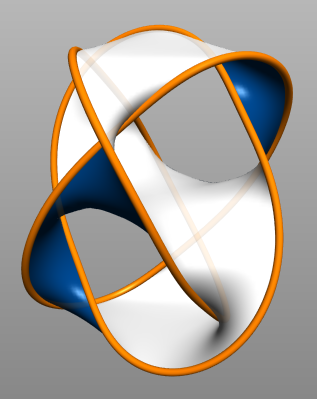
In algebraic geometry and theoretical physics, mirror symmetry is a relationship between geometric objects called Calabi–Yau manifolds. The term refers to a situation where two Calabi–Yau manifolds look very different geometrically but are nevertheless equivalent when employed as extra dimensions of string theory.
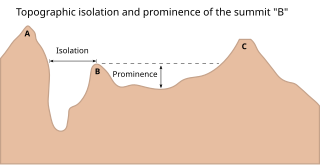
In topography, prominence measures the height of a mountain or hill's summit relative to the lowest contour line encircling it but containing no higher summit within it. It is a measure of the independence of a summit. The key col ("saddle") around the peak is a unique point on this contour line and the parent peak is some higher mountain, selected according to various criteria.
In mathematics, obstruction theory is a name given to two different mathematical theories, both of which yield cohomological invariants.
In mathematics, Tannaka–Krein duality theory concerns the interaction of a compact topological group and its category of linear representations. It is a natural extension of Pontryagin duality, between compact and discrete commutative topological groups, to groups that are compact but noncommutative. The theory is named after Tadao Tannaka and Mark Grigorievich Krein. In contrast to the case of commutative groups considered by Lev Pontryagin, the notion dual to a noncommutative compact group is not a group, but a category of representations Π(G) with some additional structure, formed by the finite-dimensional representations of G.
In computer graphics, marching squares is an algorithm that generates contours for a two-dimensional scalar field. A similar method can be used to contour 2D triangle meshes.
Digital topology deals with properties and features of two-dimensional (2D) or three-dimensional (3D) digital images that correspond to topological properties or topological features of objects.
Terrain cartography or relief mapping is the depiction of the shape of the surface of the Earth on a map, using one or more of several techniques that have been developed. Terrain or relief is an essential aspect of physical geography, and as such its portrayal presents a central problem in cartographic design, and more recently geographic information systems and geovisualization.

In the study of image processing, a watershed is a transformation defined on a grayscale image. The name refers metaphorically to a geological watershed, or drainage divide, which separates adjacent drainage basins. The watershed transformation treats the image it operates upon like a topographic map, with the brightness of each point representing its height, and finds the lines that run along the tops of ridges.

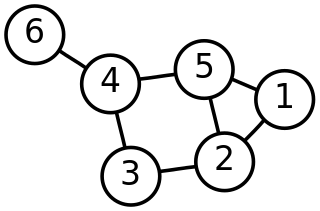
A Reeb graph is a mathematical object reflecting the evolution of the level sets of a real-valued function on a manifold. According to a similar concept was introduced by G.M. Adelson-Velskii and A.S. Kronrod and applied to analysis of Hilbert's thirteenth problem. Proposed by G. Reeb as a tool in Morse theory, Reeb graphs are the natural tool to study multivalued functional relationships between 2D scalar fields , , and arising from the conditions and , because these relationships are single-valued when restricted to a region associated with an individual edge of the Reeb graph. This general principle was first used to study neutral surfaces in oceanography.
Boundary tracing, also known as contour tracing, of a binary digital region can be thought of as a segmentation technique that identifies the boundary pixels of the digital region. Boundary tracing is an important first step in the analysis of that region. Boundary is a topological notion. However, a digital image is no topological space. Therefore, it is impossible to define the notion of a boundary in a digital image mathematically exactly. Most publications about tracing the boundary of a subset S of a digital image I describe algorithms which find a set of pixels belonging to S and having in their direct neighborhood pixels belonging both to S and to its complement I - S. According to this definition the boundary of a subset S is different from the boundary of the complement I – S which is a topological paradox.
References
- ↑ Cox, J.; Karron, D. B.; Ferdous, N. (2003). "Topological Zone Organization of Scalar Volume Data". Journal of Mathematical Imaging and Vision. 18 (2): 95–117. doi:10.1023/A:1022113114311. S2CID 24983543.
- ↑ Cox, J.; Karron, D.B.; Ferdous, N. (2002). "Digital Morse Theory for scalar volume data" (PDF). DIMACS 2003. Archived from the original (PDF) on 2009-01-24.
- Sanjay Rana (2004). Topological Data Structures for Surfaces. Wiley. ISBN 978-0470851517.