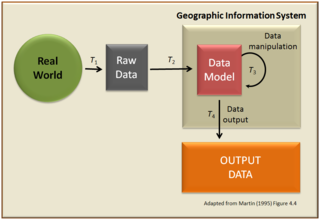
A geographic information system (GIS) consists of integrated computer hardware and software that store, manage, analyze, edit, output, and visualize geographic data. Much of this often happens within a spatial database, however, this is not essential to meet the definition of a GIS. In a broader sense, one may consider such a system also to include human users and support staff, procedures and workflows, the body of knowledge of relevant concepts and methods, and institutional organizations.

An infection is the invasion of tissues by pathogens, their multiplication, and the reaction of host tissues to the infectious agent and the toxins they produce. An infectious disease, also known as a transmissible disease or communicable disease, is an illness resulting from an infection.

An epidemic is the rapid spread of disease to a large number of hosts in a given population within a short period of time. For example, in meningococcal infections, an attack rate in excess of 15 cases per 100,000 people for two consecutive weeks is considered an epidemic.

Epidemiology is the study and analysis of the distribution, patterns and determinants of health and disease conditions in a defined population.

In epidemiology, an outbreak is a sudden increase in occurrences of a disease when cases are in excess of normal expectancy for the location or season. It may affect a small and localized group or impact upon thousands of people across an entire continent. The number of cases varies according to the disease-causing agent, and the size and type of previous and existing exposure to the agent. Outbreaks include many epidemics, which term is normally only for infectious diseases, as well as diseases with an environmental origin, such as a water or foodborne disease. They may affect a region in a country or a group of countries. Pandemics are near-global disease outbreaks when multiple and various countries around the Earth are soon infected.
In medicine, public health, and biology, transmission is the passing of a pathogen causing communicable disease from an infected host individual or group to a particular individual or group, regardless of whether the other individual was previously infected. The term strictly refers to the transmission of microorganisms directly from one individual to another by one or more of the following means:

In epidemiology, an infection is said to be endemic in a specific population or populated place when that infection is constantly present, or maintained at a baseline level, without extra infections being brought into the group as a result of travel or similar means. An endemic disease always has a steady, predictable number of people getting sick, but that number can be high (hyperendemic) or low (hypoendemic), and the disease can be severe or mild. Also, a disease that is usually endemic can become epidemic.
Health geography is the application of geographical information, perspectives, and methods to the study of health, disease, and health care. Medical geography, a sub-discipline of or sister field of health geography, focuses on understanding spatial patterns of health and disease as related to the natural and social environment. Conventionally, there are two primary areas of research within medical geography: the first deals with the spatial distribution and determinants of morbidity and mortality, while the second deals with health planning, help-seeking behavior, and the provision of health services.

Spatial analysis is any of the formal techniques which studies entities using their topological, geometric, or geographic properties. Spatial analysis includes a variety of techniques using different analytic approaches, especially spatial statistics. In may be applied in fields as diverse as astronomy, with its studies of the placement of galaxies in the cosmos, or to chip fabrication engineering, with its use of "place and route" algorithms to build complex wiring structures. In a more restricted sense, spatial analysis is geospatial analysis, the technique applied to structures at the human scale, most notably in the analysis of geographic data. It may also be applied to genomics, as in transcriptomics data.
Spatial epidemiology is a subfield of epidemiology focused on the study of the spatial distribution of health outcomes; it is closely related to health geography.
Tele-epidemiology is the application of telecommunications to epidemiological research and application, including space-based and internet-based systems.

In health care facilities, isolation represents one of several measures that can be taken to implement in infection control: the prevention of communicable diseases from being transmitted from a patient to other patients, health care workers, and visitors, or from outsiders to a particular patient. Various forms of isolation exist, in some of which contact procedures are modified, and others in which the patient is kept away from all other people. In a system devised, and periodically revised, by the U.S. Centers for Disease Control and Prevention (CDC), various levels of patient isolation comprise application of one or more formally described "precaution".
Geographic information systems (GISs) and geographic information science (GIScience) combine computer-mapping capabilities with additional database management and data analysis tools. Commercial GIS systems are very powerful and have touched many applications and industries, including environmental science, urban planning, agricultural applications, and others.

A dot distribution map is a type of thematic map that uses a point symbol to visualize the geographic distribution of a large number of related phenomena. Dot maps are a type of unit visualizations that rely on a visual scatter to show spatial patterns, especially variances in density. The dots may represent the actual locations of individual phenomena, or be randomly placed in aggregation districts to represent a number of individuals. Although these two procedures, and their underlying models, are very different, the general effect is the same.
Esri Canada is the Canadian provider of enterprise geographic information system (GIS) solutions from Esri. GIS allows multiple layers of information to be displayed on a single map. Esri Canada’s solutions are based on ArcGIS technology. The company also distributes vertical-focused solutions. from technology partners such as Schneider Electric. A third of its offerings are professional services.

A superspreading event (SSEV) is an event in which an infectious disease is spread much more than usual, while an unusually contagious organism infected with a disease is known as a superspreader. In the context of a human-borne illness, a superspreader is an individual who is more likely to infect others, compared with a typical infected person. Such superspreaders are of particular concern in epidemiology.
Simon Iain Hay, is a British epidemiologist. He is Professor for Global Health at the University of Washington and Director of Geospatial Science at the Institute for Health Metrics and Evaluation (IHME). From 2013-2015 he served as the 52nd President of the Royal Society of Tropical Medicine and Hygiene.
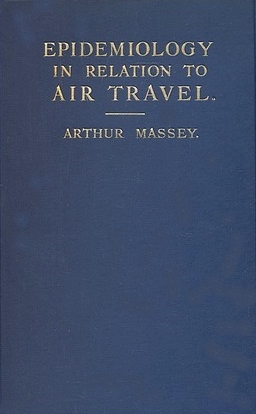
Epidemiology in Relation to Air Travel is a book by Arthur Massey, the medical officer of health of Coventry, published by H. K. Lewis and Company in 1933. By comparing the travel times of journeys by ship to those of travelling by air, he demonstrated how the quarantinable diseases plague, cholera, yellow fever and smallpox, could arrive in the UK in the early 1930s.

Web GIS, or Web Geographic Information Systems, are GIS that employ the World Wide Web to facilitate the storage, visualization, analysis, and distribution of spatial information over the Internet.
SaTScan is a software tool that employs scan statistics for the spatial and temporal analysis of clusters of events. The software is trademarked by Martin Kulldorff, and was designed originally for public health and epidemiology to identify clusters of cases in both space and time and to perform statistical analysis to determine if these clusters are significantly different from what would be expected by chance The software provides a user-friendly interface and a range of statistical methods, making it accessible to researchers and practitioners. While not a full Geographic Information System, the outputs from SaTScan can be integrated with software such as ArcGIS or QGIS to visualize and analyze spatial data, and to map the distribution of various phenomena.