Distribution of lightning

Last updated

Lightning flash density - 12 hourly averages over the year (NASA OTD/LIS) This shows that lightning is much more frequent in summer than in winter, and from noon to midnight compared to midnight to noon. Lightning Flash Density 12.gif
Lightning flash density – 12 hourly averages over the year (NASA OTD/LIS) This shows that lightning is much more frequent in summer than in winter, and from noon to midnight compared to midnight to noon.

The distribution of lightning, or the incidence of individual strikes, in any particular place is highly dependent on its location, climate, and time of year. Lightning does have an underlying spatial distribution. High quality lightning data has only recently become available, but the data indicates that lightning occurs on average 44±5 times every second over the entire Earth, making a total of about 1.4  billion flashes per year. [1] [2]

Contents

Ratios of lightning types

The lightning flash rate averaged over the Earth for intra-cloud (IC) + cloud-to-cloud (CC) to cloud-to-ground (CG) is in the ratio: (IC+CC):CG = 3:1. The base of the negative region in a cloud is normally at roughly the elevation where freezing occurs. The closer this region is to the ground, the more likely cloud-to-ground strikes are. In the tropics, where the freeze zone is higher, the (IC+CC):CG ratio is about 9:1. In Norway, at latitude 60° N, where the freezing elevation is lower, the (IC+CC):CG ratio is about 1:1. [3] [4]

Distribution

Global map of lightning frequency--strikes/km /yr. The high lightning areas are on land located in the tropics. Areas with almost no lightning are the Arctic and Antarctic, closely followed by the oceans which have only 0.1 to 1 strikes/km /yr. Global Lightning Frequency.png
Global map of lightning frequency--strikes/km /yr. The high lightning areas are on land located in the tropics. Areas with almost no lightning are the Arctic and Antarctic, closely followed by the oceans which have only 0.1 to 1 strikes/km /yr.

The map on the right shows that lightning is not distributed evenly around the planet. [5] About 70% of lightning occurs on land in the Tropics, where the majority of thunderstorms occur. The North and South Poles and the areas over the oceans have the fewest lightning strikes. The place where lightning occurs most often is above the Catatumbo river, which feeds Lake Maracaibo in Venezuela, where the so-called Catatumbo lightning flashes several times per minute, with lightning happening up to 300 nights a year. This gives Lake Maracaibo the highest number of lightning strikes per square kilometer in the world, at 250. [6] The region with the second-most is the village Kifuka, in the mountains of the Democratic Republic of the Congo, [7] where the elevation is around 1,700 metres (5,600 ft), receives 232 lightning strikes per square kilometer (409 per sq mi) a year. [2] [8]

Malaysia and Singapore have one of the highest rates of lightning activity in the world, after Indonesia and Colombia. [9] The city of Teresina in northern Brazil has the third-highest rate of occurrences of lightning strikes in the world. The surrounding region is referred to as the Chapada do Corisco ("Flash Lightning Flatlands"). [10]

In the United States, the west coast has the fewest lightning strikes, and Florida sees more lightning than any other area; In 2018, 14 Florida counties ranked in the top 15 counties in the United States for having the highest lightning density. [11] Florida has the largest number of recorded strikes during summer.[ citation needed ] Much of Florida is a peninsula, bordered by the ocean on three sides with a subtropical climate. The result is the nearly daily development of clouds that produce thunderstorms. For example, "Lightning Alley"—an area from Tampa to Orlando—experiences an extremely high density of lightning strikes. As of 2007, there were as many as 50 strikes per square mile (about 20 per km2) per year. [12] [13] In their 2018 Annual Lightning Report, Vaisala reported there were as many as 24 strikes per square mile (about 9 per km2) per year in Florida. [11] The Empire State Building in New York City is struck by lightning on average 23 times each year, and was once struck 8 times in 24 minutes. [14]

Lightning data sources

World map showing frequency of lightning strikes, in flashes per square kilometer (km2) per year (equal-area projection). Lightning strikes most frequently in the Democratic Republic of the Congo.
Combined 1995-2003 data from the Optical Transient Detector and 1998-2003 data from the Lightning Imaging Sensor. Global lightning strikes.png
World map showing frequency of lightning strikes, in flashes per square kilometer (km²) per year (equal-area projection). Lightning strikes most frequently in the Democratic Republic of the Congo.
Combined 1995–2003 data from the Optical Transient Detector and 1998–2003 data from the Lightning Imaging Sensor.

Before technology was developed to accurately detect and record lightning flashes, climatologies were based upon the number of audible detection of thunder. The keraunic (or ceraunic) level was the average number of days per year when thunder was heard in a given area. A map of isokeraunic contours was used to give a rough estimate of relative lightning frequencies. However, variations in population, the distance sound travels due to terrain made such maps quite spurious, and human hearing made such maps imprecise. It also could not hope to differentiate between different types of lightning.

Electronic lightning sensors advanced during the 20th century using radio wave disruptions. Originally the expense of such instruments caused only sporadic development. However a small set of sensors in the U.S. employed during a 1979 project by NOAA’s National Severe Storms Laboratory grew into the National Lightning Detection Network (NLDN), achieving nationwide coverage in 1989. [15] Vaisala is now the operator and primary distributor of data from the NLDN, and developed the Canadian Lightning Detection Network (CLDN) as of 1998. [16] The EUCLID network is the European shared network, covering most of the continent apart from some far eastern nations. [17] Collaborative amateur development spurred the formation of the Blitzortung community, which offers real-time lightning strike data from most of the world (as well as historical data dating back to 2008) under the Creative Commons license. [18]

Satellite lightning measurements began in 1997 when NASA and National Space Development Agency (NASDA) of Japan launched the Lightning Imaging Sensor (LIS) aboard the TRMM satellite, providing periodic scan swaths over tropical and sub-tropical portions of the globe until the satellite's was lost in 2015. In 2017 NOAA started deployment of Geostationary Lightning Mappers aboard their GOES-R class satellites, offering continual coverage of much of the land within the western Hemisphere.

Maps of the U.S. lightning strike/km2yr averaged from 1997-2010 are available from Vaisala's webpage for a fee. [19] More detailed U.S. regional lightning maps based on the National Oceanic and Atmospheric Administration (NOAA) and the National Weather Service (NWS) data centered on different cities are put out by the Cooperative Institute for Applied Meteorological Studies at Texas A&M University. [20]

Related Research Articles

<span class="mw-page-title-main">Tornado</span> Violently rotating column of air in contact with both the Earths surface and a cumulonimbus cloud

A tornado is a violently rotating column of air that is in contact with both the surface of the Earth and a cumulonimbus cloud or, in rare cases, the base of a cumulus cloud. It is often referred to as a twister, whirlwind or cyclone, although the word cyclone is used in meteorology to name a weather system with a low-pressure area in the center around which, from an observer looking down toward the surface of the Earth, winds blow counterclockwise in the Northern Hemisphere and clockwise in the Southern. Tornadoes come in many shapes and sizes, and they are often visible in the form of a condensation funnel originating from the base of a cumulonimbus cloud, with a cloud of rotating debris and dust beneath it. Most tornadoes have wind speeds less than 180 kilometers per hour, are about 80 meters across, and travel several kilometers before dissipating. The most extreme tornadoes can attain wind speeds of more than 480 kilometers per hour (300 mph), are more than 3 kilometers (2 mi) in diameter, and stay on the ground for more than 100 km (62 mi).

<span class="mw-page-title-main">Lightning</span> Weather phenomenon involving electrostatic discharge

Lightning is a natural phenomenon formed by electrostatic discharges through the atmosphere between two electrically charged regions, either both in the atmosphere or with one in the atmosphere and on the ground, temporarily neutralizing these in a near-instantaneous release of an average of one gigajoule of energy. This discharge may produce a wide range of electromagnetic radiation, from heat created by the rapid movement of electrons, to brilliant flashes of visible light in the form of black-body radiation. Lightning causes thunder, a sound from the shock wave which develops as gases in the vicinity of the discharge experience a sudden increase in pressure. Lightning occurs commonly during thunderstorms as well as other types of energetic weather systems, but volcanic lightning can also occur during volcanic eruptions. Lightning is an atmospheric electrical phenomenon and contributes to the global atmospheric electrical circuit.

<span class="mw-page-title-main">Thunderstorm</span> Type of weather with lightning and thunder

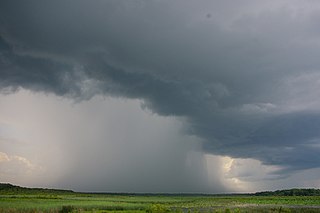
A thunderstorm, also known as an electrical storm or a lightning storm, is a storm characterized by the presence of lightning and its acoustic effect on the Earth's atmosphere, known as thunder. Relatively weak thunderstorms are sometimes called thundershowers. Thunderstorms occur in a type of cloud known as a cumulonimbus. They are usually accompanied by strong winds and often produce heavy rain and sometimes snow, sleet, or hail, but some thunderstorms produce little precipitation or no precipitation at all. Thunderstorms may line up in a series or become a rainband, known as a squall line. Strong or severe thunderstorms include some of the most dangerous weather phenomena, including large hail, strong winds, and tornadoes. Some of the most persistent severe thunderstorms, known as supercells, rotate as do cyclones. While most thunderstorms move with the mean wind flow through the layer of the troposphere that they occupy, vertical wind shear sometimes causes a deviation in their course at a right angle to the wind shear direction.

<span class="mw-page-title-main">Heat lightning</span> Description of distant cloud to ground lightning

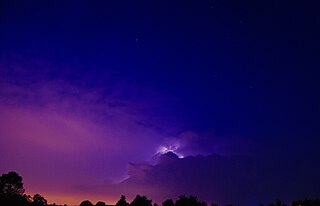
Heat lightning, also known as silent lightning, summer lightning, or dry lightning, is a misnomer used for the faint flashes of lightning on the horizon or other clouds from distant thunderstorms that do not appear to have accompanying sounds of thunder.

<span class="mw-page-title-main">Weather satellite</span> Type of satellite designed to record the state of the Earths atmosphere

A weather satellite or meteorological satellite is a type of Earth observation satellite that is primarily used to monitor the weather and climate of the Earth. Satellites can be polar orbiting, or geostationary.

<span class="mw-page-title-main">Index of meteorology articles</span>

This is a list of meteorology topics. The terms relate to meteorology, the interdisciplinary scientific study of the atmosphere that focuses on weather processes and forecasting.

The National Severe Storms Laboratory (NSSL) is a National Oceanic and Atmospheric Administration (NOAA) weather research laboratory under the Office of Oceanic and Atmospheric Research. It is one of seven NOAA Research Laboratories (RLs).

<span class="mw-page-title-main">Lightning strike</span> Electric discharge between the atmosphere and the ground

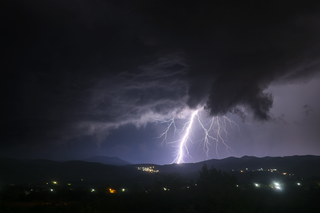
A lightning strike is a lightning event in which the electric discharge takes place between the atmosphere and the ground. Most originate in a cumulonimbus cloud and terminate on the ground, called cloud-to-ground (CG) lightning. A less common type of strike, ground-to-cloud (GC) lightning, is upward-propagating lightning initiated from a tall grounded object and reaching into the clouds. About 25% of all lightning events worldwide are strikes between the atmosphere and earth-bound objects. Most are intracloud (IC) lightning and cloud-to-cloud (CC), where discharges only occur high in the atmosphere. Lightning strikes the average commercial aircraft at least once a year, but modern engineering and design means this is rarely a problem. The movement of aircraft through clouds can even cause lightning strikes.

<span class="mw-page-title-main">Field mill</span>

A field mill is a specialized instrument used for measuring the strength of electric fields in the atmosphere, one of the key parameters of atmospheric electricity. They are used in the launch criteria for rockets bound for orbit, as well as the now-retired Space Shuttle, to avoid lightning strikes. They are also used in outdoor laboratories for lightning protection equipment to determine favorable experiment conditions, or simply to measure the atmospheric electric field away from thunderstorms.

<span class="mw-page-title-main">Lightning detection</span> Remote observation of lightning strikes

A lightning detector is a device that detects lightning produced by thunderstorms. There are three primary types of detectors: ground-based systems using multiple antennas, mobile systems using a direction and a sense antenna in the same location, and space-based systems.

<span class="mw-page-title-main">Sprite (lightning)</span> Electrical discharges above thunderstorm clouds

Sprites or red sprites are large-scale electric discharges that occur in the mesosphere, high above thunderstorm clouds, or cumulonimbus, giving rise to a varied range of visual shapes flickering in the night sky. They are usually triggered by the discharges of positive lightning between an underlying thundercloud and the ground.

Convective storm detection is the meteorological observation, and short-term prediction, of deep moist convection (DMC). DMC describes atmospheric conditions producing single or clusters of large vertical extension clouds ranging from cumulus congestus to cumulonimbus, the latter producing thunderstorms associated with lightning and thunder. Those two types of clouds can produce severe weather at the surface and aloft.

<span class="mw-page-title-main">Automated airport weather station</span> Automated sensor suites

Airport weather stations are automated sensor suites which are designed to serve aviation and meteorological operations, weather forecasting and climatology. Automated airport weather stations have become part of the backbone of weather observing in the United States and Canada and are becoming increasingly more prevalent worldwide due to their efficiency and cost-savings.

<span class="mw-page-title-main">Catatumbo lightning</span> Atmospheric phenomenon in Venezuela

Catatumbo lightning is an atmospheric phenomenon that occurs over the mouth of the Catatumbo River where it empties into Lake Maracaibo in Venezuela. Catatumbo means "House of Thunder" in the language of the Bari people. It originates from a mass of storm clouds at an altitude of more than 1 km (0.6 mi), and occurs for 140 to 160 nights a year, nine hours per day, and with lightning flashes from 16 to 40 times per minute. It occurs over and around Lake Maracaibo, typically over a bog area formed where the Catatumbo River flows into the lake. The phenomenon sees the highest density of lightning in the world, at 250 per km2.

<span class="mw-page-title-main">Atmospheric noise</span> Noise generated by an atmosphere

Atmospheric noise is radio noise caused by natural atmospheric processes, primarily lightning discharges in thunderstorms. On a worldwide scale, there are about 40 lightning flashes per second – ≈3.5 million lightning discharges per day.

<span class="mw-page-title-main">GOES-16</span> American geosynchronous environmental satellite

<span class="mw-page-title-main">GOES-17</span> NOAA environmental satellite

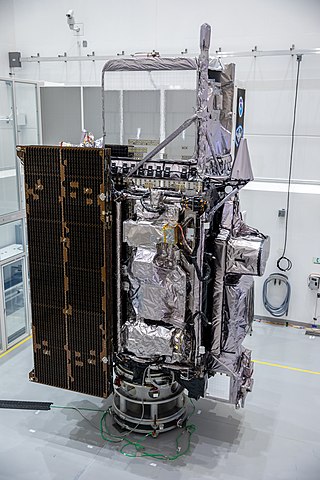
GOES-17 is an environmental satellite operated by the National Oceanic and Atmospheric Administration (NOAA). The satellite is second in the four-satellite GOES-R series. GOES-17 supports the Geostationary Operational Environmental Satellite (GOES) system, providing multi-spectral imaging for weather forecasts and meteorological and environmental research. The satellite was built by Lockheed Martin, based on the A2100A platform, and expected to have a useful life of 15 years. GOES-17 is intended to deliver high-resolution visible and infrared imagery and lightning observations of more than half the globe.

<span class="mw-page-title-main">GOES-18</span>

GOES-18 is the third of the "GOES-R Series", the current generation of weather satellites operated by the National Oceanic and Atmospheric Administration (NOAA). The current and next satellites of the Series will extend the availability of the Geostationary Operational Environmental Satellite (GOES) satellite system until 2037. The satellite is built by Lockheed Martin in Littleton, Colorado. It is based on the A2100A satellite bus and will have an expected useful life of 15 years.

<span class="mw-page-title-main">Thor experiment</span> Experiment aimed to investigate electrical activity

The Thor experiment aims to investigate electrical activity from thunderstorms and convection related to water vapour transport. The experiment is named as 'Thor' after the god of thunder, lightning and storms in Nordic mythology. The experiment is conducted by European Space Agency with a thundercloud imaging system 400 km above Earth.

ALDIS is a sensor network in Austria for the detection and localization of lightning discharge occurring during thunderstorms. In addition to the location of the strike point, the associated peak current is also estimated. ALDIS is a member of the pan-European lightning detection project EUCLID.

References

  1. John E. Oliver (2005). Encyclopedia of World Climatology. National Oceanic and Atmospheric Administration. ISBN   978-1-4020-3264-6 . Retrieved February 8, 2009.
  2. 1 2 "Annual Lightning Flash Rate". National Oceanic and Atmospheric Administration. Archived from the original on March 24, 2014. Retrieved January 15, 2013.
  3. "Where LightningStrikes". NASA Science. Science News. 2001-12-05. Retrieved July 5, 2010.
  4. Uman, Martin A.' "All About Lightning"; Ch. 8; p. 68, Dover Publications N.Y.; 1986; ISBN   9780486252377
  5. P.R. Field; W.H. Hand; G. Cappelluti; et al. (November 2010). "Hail Threat Standardisation" (PDF). European Aviation Safety Agency. RP EASA.2008/5. Archived from the original (PDF) on 2013-12-07.
  6. Ore, Diego (7 November 2014). "The 'Catatumbo Lightning': Venezuela's eternal storm". Reuters. Retrieved 23 November 2022.
  7. "Kifuka – place where lightning strikes most often". Wondermondo. 7 November 2010. Retrieved November 21, 2010.
  8. Rodrigo E. Burgesser; Maria G. Nicora; Eldo E. A´ vila. "Characterization of the lightning activity of Rela´mpago del Catatumbo" (PDF). wwln.net. Retrieved 23 November 2022.
  9. "M'sia third highest in lightning strikes".
  10. Paesi Online. "Teresina: Vacations and Tourism". Paesi Online. Retrieved September 24, 2007.
  11. 1 2 Vaisala (2019). "Vaisala 2018 Annual Lightning Report" (PDF). Vaisala . Retrieved January 9, 2019.
  12. NASA (2007). "Staying Safe in Lightning Alley". NASA . Retrieved September 24, 2007.
  13. Kevin Pierce (2000). "Summer Lightning Ahead". Florida Environment.com. Archived from the original on October 12, 2007. Retrieved September 24, 2007.
  14. Uman, Martin A.' "All About Lightning"; Ch. 6, p. 47, Dover Publications N.Y.; 1986; ISBN   9780486252377
  15. Orville, Richard (February 2008). "Development of the National Lightning Detection Network". Bulletin of the American Meteorological Society. 89 (2): 180–190. Bibcode:2008BAMS...89..180O. doi: 10.1175/BAMS-89-2-180 .
  16. https://www.vaisala.com/sites/default/files/documents/CLDN%20Brochure%20B210413EN-a.pdf [ bare URL PDF ]
  17. "Home". euclid.org.
  18. "Lightning & Thunderstorms - Impress / Contact".
  19. VAISALA US lightning strike density map Accessed 13 Jul 2017
  20. U.S. regional lightning strike maps Accessed 30 Jul 2012