The Dogs of the Dow is an investment strategy popularized by Michael B. O'Higgins in a 1991 book and his Dogs of the Dow website. [1]
The strategy proposes that an investor annually select for investment the ten stocks listed on the Dow Jones Industrial Average whose dividend is the highest fraction of their price, i.e. stocks with the highest dividend yield. Under other analysis these stocks could be considered "dogs", or undesirable, as companies often raise their dividend in response to bad news or a decline in share price. But the Dogs of the Dow strategy proposes these same stocks have the potential for substantial increases in stock price plus relatively high dividend payouts. [2]
Independent research has produced conflicting results. Some studies find mixed or negative results for the method, but application of the method to international markets confirmed the Dogs of the Dow method may offer superior long-term results.
Though popularized in the 1990s by O'Higgins, the "Dogs of the Dow" or "Dow 10" theory has an older history.
An article by H. G. Schneider was published in The Journal of Finance in 1951, based on selecting stocks by their price–earnings ratio. [3]
The method was discussed in The Wall Street Journal in the early 1980s. [4]
Proponents of the Dogs of the Dow strategy argue that the blue-chip companies that make up the Dow Jones Industrial Average are better able to withstand market and economic downturns and maintain their high dividend yield due to their access to factors such as their established business and brands, access to credit markets, ability to hire top-level management, ability to acquire dynamic companies, etc. Since a high yield often occurs after a significant stock price decline, a high dividend relative to stock price for a blue-chip company tends to suggest that the stock may be a reasonable value with the potential for the stock price to rebound in conjunction with a high dividend payout. One reason the Dogs of the Dow strategy is attractive is because it requires minimal effort. By analyzing the dividend yields of stocks contained within the Dow, those stocks that are potentially undervalued are readily apparent because, all else being equal, as the stock price declines, the dividend yield increases because the dividend payout represents a larger portion of the stock price. The dividend yield is calculated by dividing the annual dividend by the current stock price.
Under this model, the investor buys an equal number of the ten company's shares. The investor re-invests all dividends or capital gains, and long-term may obtain superior results. The data from Dogs of the Dow [5] suggests that this has been the case since the turn of the century. The logic behind this is that a high-dividend yield suggests both that the stock is oversold (or under-valued) and that management believes in its company's prospects and is willing to back that up by paying out a relatively high dividend. Investors are thereby hoping to benefit from both above-average stock-price gains as well as a relatively high quarterly dividend that can be re-invested to buy additional shares.
Due to the nature of the concept and limited number of stocks involved, the Dogs of the Dow will likely not cover all market sectors. For example, the ten stocks that belonged to the 2019 Dogs of the Dow list came from only seven sectors, including technology, energy, and healthcare, [6] in contrast to the S&P 500 Index which covers eleven sectors.
O'Higgins and others back-tested the strategy as far back as the 1920s and found that investing in the Dogs consistently outperformed the market as a whole. Since that time, the data shows that the Dogs of the Dow as well as the popular variant, the Small Dogs of the Dow, have performed well.
For example, for the twenty years from 1992 to 2011, the Dogs of the Dow on average matched the average annual total return of the DJIA (10.8 percent) and outperformed the S&P 500 (9.6 percent). [1]
The Small Dogs of the Dow, which are the five lowest-priced Dogs of the Dow, outperformed both the Dow and S&P 500 with an average annual total return of 12.6 percent. [5]
When each individual year is reviewed, it is clear that both the Dogs of the Dow and Small Dogs of the Dow did not consistently perform well on a yearly basis In fact, the Dogs of the Dow and Small Dogs of the Dow struggled to keep up with the Dow during latter stages of the dot-com boom (1998 and 1999) as well as during the financial crisis (2007–2009). [1] This suggests that an investor would be best served by viewing this as a longer-term strategy by giving this portfolio of stocks time to recover in case of a rare-but-extreme economic event (e.g., dot-com boom, financial crisis).
A 1998 study found the Dogs of the Dow exploited the "market overreaction hypothesis", taking advantage of investor psychology and the tendency to overreact to negative news. However, the study also noted that the Dow stocks with high-dividend yield were not necessarily the worst performers any given year, which might undermine the strategy's performance occasionally. [7]
Professor Burton Malkiel discusses the Dogs of the Dow in the 1999 version of his book A Random Walk Down Wall Street . He describes the Dogs method as a combination of value investing and contrarian investing, and agrees it has a strong long-term track record but notes it can underperform for several years at a time. Malkiel questions if the method can truly contradict the random walk hypothesis and efficient market hypothesis after transaction costs.
Professor Jeremy Siegel has endorsed the Dogs of the Dow, describing it in The Future for Investors (2005) as “one of the most successful investing strategies of all time." [8] The Dogs method can be particularly effective in bear markets, according to Siegel, as “dividends cushioned the declines in the market”.
The Dogs of the Dow method has been studied internationally and adapted to many foreign markets. Research shows over long-periods, the Dogs method tends to result in superior risk-adjusted performance relative to market averages. However, the method may also result in more volatility and short-term underperformance. Studies have analyzed the method in Finland; [9] Japan; [10] China, [11] and six small nations in Southeast Asia. [12]
On January 8, 2014, asset manager John S. Tobey wrote an article in Forbes magazine where he criticized the Dogs method. Tobey proposed the equal-weighting method for the Dogs made it difficult or impossible to accurately compare to the DJIA, which uses a different method of price-weighting the stocks. He said that, for the year 2013, using the price weighting the Dogs would have returned less, rather than more, than the DJIA. He suggested that the Dogs strategy is too simple and it neglects factors such as dividend–payout ratio (i.e., how much of the company's profits are devoted to dividends), growth of cash and earnings, and price performance. However, he did not offer advice on how to integrate these factors into the Dogs method. He also criticized the Dogs strategy for back-testing, which can be susceptible to data mining or other shortcomings. He also predicted that the strategy would not work well for 2014. [13]
A 2019 study found the Dogs of the Dow had been disappointing in the few previous years, after taxes and transaction costs, and also suggested holding the 30 Dow stocks equally-weighted will be superior to both the DJIA and the Dogs of the Dow. [14]
Passive management is an investing strategy that tracks a market-weighted index or portfolio. Passive management is most common on the equity market, where index funds track a stock market index, but it is becoming more common in other investment types, including bonds, commodities and hedge funds.

A dividend is a distribution of profits by a corporation to its shareholders. When a corporation earns a profit or surplus, it is able to pay a portion of the profit as a dividend to shareholders. Any amount not distributed is taken to be re-invested in the business. The current year profit as well as the retained earnings of previous years are available for distribution; a corporation is usually prohibited from paying a dividend out of its capital. Distribution to shareholders may be in cash or, if the corporation has a dividend reinvestment plan, the amount can be paid by the issue of further shares or by share repurchase. In some cases, the distribution may be of assets.

The Dow Jones Industrial Average (DJIA), Dow Jones, or simply the Dow, is a stock market index of 30 prominent companies listed on stock exchanges in the United States.

A stock market crash is a sudden dramatic decline of stock prices across a major cross-section of a stock market, resulting in a significant loss of paper wealth. Crashes are driven by panic selling and underlying economic factors. They often follow speculation and economic bubbles.
An index fund is a mutual fund or exchange-traded fund (ETF) designed to follow certain preset rules so that it can replicate the performance ("track") of a specified basket of underlying investments. While index providers often emphasize that they are for-profit organizations, index providers have the ability to act as "reluctant regulators" when determining which companies are suitable for an index. Those rules may include tracking prominent indices like the S&P 500 or the Dow Jones Industrial Average or implementation rules, such as tax-management, tracking error minimization, large block trading or patient/flexible trading strategies that allow for greater tracking error but lower market impact costs. Index funds may also have rules that screen for social and sustainable criteria.
In finance, technical analysis is an analysis methodology for analysing and forecasting the direction of prices through the study of past market data, primarily price and volume. As a type of active management, it stands in contradiction to much of modern portfolio theory. The efficacy of technical analysis is disputed by the efficient-market hypothesis, which states that stock market prices are essentially unpredictable, and research on whether technical analysis offers any benefit has produced mixed results. It is distinguished from fundamental analysis, which considers a company's financial statements, health, and the overall state of the market and economy.
The dividend yield or dividend–price ratio of a share is the dividend per share divided by the price per share. It is also a company's total annual dividend payments divided by its market capitalization, assuming the number of shares is constant. It is often expressed as a percentage.
The January effect is a hypothesis that there is a seasonal anomaly in the financial market where securities' prices increase in the month of January more than in any other month. This calendar effect would create an opportunity for investors to buy stocks for lower prices before January and sell them after their value increases. As with all calendar effects, if true, it would suggest that the market is not efficient, as market efficiency would suggest that this effect should disappear.
Contrarian investing is an investment strategy that is characterized by purchasing and selling in contrast to the prevailing sentiment of the time.
The Motley Fool is a private financial and investing advice company based in Alexandria, Virginia. It was founded in July 1993 by co-chairmen and brothers David Gardner and Tom Gardner, and Todd Etter and Erik Rydholm. The company employs over 300 people worldwide.
In finance, an investment strategy is a set of rules, behaviors or procedures, designed to guide an investor's selection of an investment portfolio. Individuals have different profit objectives, and their individual skills make different tactics and strategies appropriate. Some choices involve a tradeoff between risk and return. Most investors fall somewhere in between, accepting some risk for the expectation of higher returns. Investors frequently pick investments to hedge themselves against inflation. During periods of high inflation investments such as shares tend to perform less well in real terms.
Fundamentally based indexes or fundamental indexes, also called fundamentally weighted indexes, are indexes in which stocks are weighted according to factors related to their fundamentals such as earnings, dividends and assets, commonly used when performing corporate valuations. Indexes that use a composite of several fundamental factors attempt to average out sector biases that may arise from relying on a single fundamental factor. A key belief behind the fundamental index methodology is that underlying corporate accounting/valuation figures are more accurate estimators of a company's intrinsic value, rather than the listed market value of the company, i.e. that one should buy and sell companies in line with their accounting figures rather than according to their current market prices. In this sense fundamental indexing is linked to so-called fundamental analysis.
Dow 36,000: The New Strategy for Profiting From the Coming Rise in the Stock Market is a 1999 book by syndicated columnist James K. Glassman and economist Kevin A. Hassett, in which they argued that stocks in 1999 were significantly undervalued and concluded that there would be a fourfold market increase with the Dow Jones Industrial Average (DJIA) rising to 36,000 by 2002 or 2004. The bursting of the dot-com bubble of 2000, September 11 attacks in 2001, and the Financial crisis of 2007–2008 ensured that the titular target would not be attained within the author's suggested timeframe. It wasn't until 2021 when Dow 36,000 would be reached in actuality, 22 years after the book was published.
The CBOE S&P DJIA BuyWrite Index is a benchmark index designed to show the hypothetical performance of a portfolio that engages in a buy-write strategy on the Dow Jones Industrial Average (DJIA).

Stocks for the Long Run is a book on investing by Jeremy Siegel. Its first edition was released in 1994. Its fifth edition was released on January 7, 2014. According to Pablo Galarza of Money, "His 1994 book Stocks for the Long Run sealed the conventional wisdom that most of us should be in the stock market." James K. Glassman, a financial columnist for The Washington Post, called it one of the 10 best investment books of all time.
A high-yield stock is a stock whose dividend yield is higher than the yield of any benchmark average such as the ten-year US Treasury note. The classification of a high-yield stock is relative to the criteria of any given analyst. Some analysts may consider a 2% dividend yield to be high, whilst others may consider 2% to be low. There is no set standard for judging whether a dividend yield is high or low. Many analysts do however use indicators such as the previously mentioned comparison between the stock's dividend yield and the 10-Year US Treasury Note.

The US bear market of 2007–2009 was a 17-month bear market that lasted from October 9, 2007 to March 9, 2009, during the financial crisis of 2007–2009. The S&P 500 lost approximately 50% of its value, but the duration of this bear market was just below average.

In finance, a stock index, or stock market index, is an index that measures the performance of a stock market, or of a subset of a stock market. It helps investors compare current stock price levels with past prices to calculate market performance.
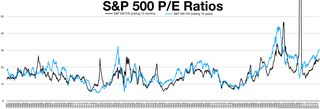
The cyclically adjusted price-to-earnings ratio, commonly known as CAPE, Shiller P/E, or P/E 10 ratio, is a valuation measure usually applied to the US S&P 500 equity market. It is defined as price divided by the average of ten years of earnings, adjusted for inflation. As such, it is principally used to assess likely future returns from equities over timescales of 10 to 20 years, with higher than average CAPE values implying lower than average long-term annual average returns.
Jeremy James Siegel is an American economist who is the Russell E. Palmer Professor of Finance at the Wharton School of the University of Pennsylvania. Siegel comments extensively on the economy and financial markets. He appears regularly on networks including CNN, CNBC and NPR, and writes regular columns for Kiplinger's Personal Finance and Yahoo! Finance. Siegel's paradox is named after him.