
A histogram is an approximate representation of the distribution of numerical data. It was first introduced by Karl Pearson. To construct a histogram, the first step is to "bin" the range of values—that is, divide the entire range of values into a series of intervals—and then count how many values fall into each interval. The bins are usually specified as consecutive, non-overlapping intervals of a variable. The bins (intervals) must be adjacent and are often of equal size.
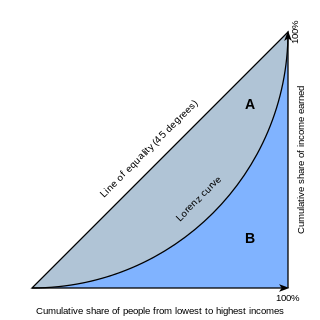
In economics, the Lorenz curve is a graphical representation of the distribution of income or of wealth. It was developed by Max O. Lorenz in 1905 for representing inequality of the wealth distribution.

In statistics, a power law is a functional relationship between two quantities, where a relative change in one quantity results in a proportional relative change in the other quantity, independent of the initial size of those quantities: one quantity varies as a power of another. For instance, considering the area of a square in terms of the length of its side, if the length is doubled, the area is multiplied by a factor of four.

In probability theory and statistics, the Weibull distribution is a continuous probability distribution. It is named after Swedish mathematician Waloddi Weibull, who described it in detail in 1951, although it was first identified by Fréchet (1927) and first applied by Rosin & Rammler (1933) to describe a particle size distribution.

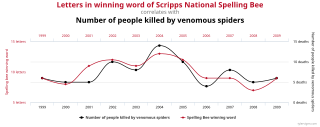
In statistics, Spearman's rank correlation coefficient or Spearman's ρ, named after Charles Spearman and often denoted by the Greek letter (rho) or as , is a nonparametric measure of rank correlation. It assesses how well the relationship between two variables can be described using a monotonic function.

In analytical chemistry, a calibration curve, also known as a standard curve, is a general method for determining the concentration of a substance in an unknown sample by comparing the unknown to a set of standard samples of known concentration. A calibration curve is one approach to the problem of instrument calibration; other standard approaches may mix the standard into the unknown, giving an internal standard.

In economics, comparative statics is the comparison of two different economic outcomes, before and after a change in some underlying exogenous parameter.
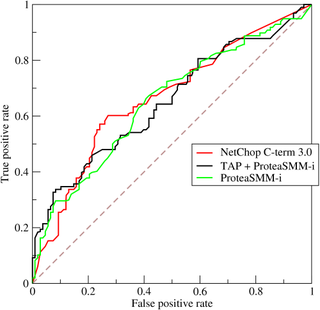
A receiver operating characteristic curve, or ROC curve, is a graphical plot that illustrates the diagnostic ability of a binary classifier system as its discrimination threshold is varied. The method was originally developed for operators of military radar receivers starting in 1941, which led to its name.
Data assimilation is a mathematical discipline that seeks to optimally combine theory with observations. There may be a number of different goals sought, for example—to determine the optimal state estimate of a system, to determine initial conditions for a numerical forecast model, to interpolate sparse observation data using knowledge of the system being observed, to train numerical model parameters based on observed data. Depending on the goal, different solution methods may be used. Data assimilation is distinguished from other forms of machine learning, image analysis, and statistical methods in that it utilizes a dynamical model of the system being analyzed.
In mathematics and transportation engineering, traffic flow is the study of interactions between travellers and infrastructure, with the aim of understanding and developing an optimal transport network with efficient movement of traffic and minimal traffic congestion problems.

In statistics, a Q–Q (quantile-quantile) plot is a probability plot, which is a graphical method for comparing two probability distributions by plotting their quantiles against each other. First, the set of intervals for the quantiles is chosen. A point (x, y) on the plot corresponds to one of the quantiles of the second distribution plotted against the same quantile of the first distribution. Thus the line is a parametric curve with the parameter which is the number of the interval for the quantile.
The method of standard addition is a type of quantitative analysis approach often used in analytical chemistry whereby the standard is added directly to the aliquots of analyzed sample. This method is used in situations where sample matrix also contributes to the analytical signal, a situation known as the matrix effect, thus making it impossible to compare the analytical signal between sample and standard using the traditional calibration curve approach.
Downscaling is any procedure to infer high-resolution information from low-resolution variables. This technique is based on dynamical or statistical approaches commonly used in several disciplines, especially meteorology, climatology and remote sensing. The term downscaling usually refers to an increase in spatial resolution, but it is often also used for temporal resolution.
In statistics, the multiple comparisons, multiplicity or multiple testing problem occurs when one considers a set of statistical inferences simultaneously or infers a subset of parameters selected based on the observed values. In certain fields it is known as the look-elsewhere effect.

A hydrologic model is a simplification of a real-world system that aids in understanding, predicting, and managing water resources. Both the flow and quality of water are commonly studied using hydrologic models.

A plot is a graphical technique for representing a data set, usually as a graph showing the relationship between two or more variables. The plot can be drawn by hand or by a computer. In the past, sometimes mechanical or electronic plotters were used. Graphs are a visual representation of the relationship between variables, which are very useful for humans who can then quickly derive an understanding which may not have come from lists of values. Given a scale or ruler, graphs can also be used to read off the value of an unknown variable plotted as a function of a known one, but this can also be done with data presented in tabular form. Graphs of functions are used in mathematics, sciences, engineering, technology, finance, and other areas.
In time series data, seasonality is the presence of variations that occur at specific regular intervals less than a year, such as weekly, monthly, or quarterly. Seasonality may be caused by various factors, such as weather, vacation, and holidays and consists of periodic, repetitive, and generally regular and predictable patterns in the levels of a time series.
Slope stability analysis is a static or dynamic, analytical or empirical method to evaluate the stability of earth and rock-fill dams, embankments, excavated slopes, and natural slopes in soil and rock. Slope stability refers to the condition of inclined soil or rock slopes to withstand or undergo movement. The stability condition of slopes is a subject of study and research in soil mechanics, geotechnical engineering and engineering geology. Analyses are generally aimed at understanding the causes of an occurred slope failure, or the factors that can potentially trigger a slope movement, resulting in a landslide, as well as at preventing the initiation of such movement, slowing it down or arresting it through mitigation countermeasures.
In hydrology, routing is a technique used to predict the changes in shape of a hydrograph as water moves through a river channel or a reservoir. In flood forecasting, hydrologists may want to know how a short burst of intense rain in an area upstream of a city will change as it reaches the city. Routing can be used to determine whether the pulse of rain reaches the city as a deluge or a trickle.
In statistics, linear regression is a linear approach to modelling the relationship between a scalar response and one or more explanatory variables. The case of one explanatory variable is called simple linear regression; for more than one, the process is called multiple linear regression. This term is distinct from multivariate linear regression, where multiple correlated dependent variables are predicted, rather than a single scalar variable.


