Dual-phase evolution

Last updated

Dual phase evolution (DPE) is a process that drives self-organization within complex adaptive systems. [1] It arises in response to phase changes within the network of connections formed by a system's components. DPE occurs in a wide range of physical, biological and social systems. Its applications to technology include methods for manufacturing novel materials and algorithms to solve complex problems in computation.

Contents

Introduction

Dual phase evolution (DPE) is a process that promotes the emergence of large-scale order in complex systems. It occurs when a system repeatedly switches between various kinds of phases, and in each phase different processes act on the components or connections in the system. DPE arises because of a property of graphs and networks: the connectivity avalanche that occurs in graphs as the number of edges increases. [2]

Social networks provide a familiar example. In a social network the nodes of the network are people and the network connections (edges) are relationships or interactions between people. For any individual, social activity alternates between a local phase, in which they interact only with people they already know, and a global phase in which they can interact with a wide pool of people not previously known to them. Historically, these phases have been forced on people by constraints of time and space. People spend most of their time in a local phase and interact only with those immediately around them (family, neighbors, colleagues). However, intermittent activities such as parties, holidays, and conferences involve a shift into a global phase where they can interact with different people they do not know. Different processes dominate each phase. Essentially, people make new social links when in the global phase, and refine or break them (by ceasing contact) while in the local phase.

The DPE mechanism

The following features are necessary for DPE to occur. [1]

Underlying network

DPE occurs where a system has an underlying network. That is, the system's components form a set of nodes and there are connections (edges) that join them. For example, a family tree is a network in which the nodes are people (with names) and the edges are relationships such as "mother of" or "married to". The nodes in the network can take physical form, such as atoms held together by atomic forces, or they may be dynamic states or conditions, such as positions on a chess board with moves by the players defining the edges.

In mathematical terms (graph theory), a graph is a set of nodes and a set of edges . Each edge provides a link between a pair of nodes and . A network is a graph in which values are assigned to the nodes and/or edges.

Phase shifts

Graphs and networks have two phases: disconnected (fragmented) and connected. In the connected phase every node is connected by an edge to at least one other node and for any pair of nodes, there is at least one path (sequence of edges) joining them.

The Erdős–Rényi model shows that random graphs undergo a connectivity avalanche as the density of edges in a graph increases. [2] This avalanche amounts to a sudden phase change in the size of the largest connected subgraph. In effect, a graph has two phases: connected (most nodes are linked by pathways of interaction) and fragmented (nodes are either isolated or form small subgraphs). These are often referred to as global and local phases, respectively.

Fragmented graph. Figure1a.gif
Fragmented graph.
Connected graph. Figure1b.gif
Connected graph.

An essential feature of DPE is that the system undergoes repeated shifts between the two phases. In many cases, one phase is the system's normal state and it remains in that phase until shocked into the alternate phase by a disturbance, which may be external in origin.

Selection and variation

In each of the two phases, the network is dominated by different processes. [1] In a local phase, the nodes behave as individuals; in the global phase, nodes are affected by interactions with other nodes. Most commonly the two processes at work can be interpreted as variation and selection. Variation refers to new features, which typically appear in one of the two phases. These features may be new nodes, new edges, or new properties of the nodes or edges. Selection here refers to ways in which the features are modified, refined, selected or removed. A simple example would be new edges being added at random in the global phase and edges being selectively removed in the local phase.

System memory

The effects of changes in one phase carry over into the other phase. This means that the processes acting in each phase can modify or refine patterns formed in the other phase. For instance, in a social network, if a person makes new acquaintances during a global phase, then some of these new social connections might survive into the local phase to become long-term friends. In this way, DPE can create effects that may be impossible if both processes act at the same time.

Examples

DPE has been found to occur in many natural and artificial systems. [3]

Social networks

DPE is capable of producing social networks with known topologies, notably small-world networks and scale-free networks. [3] Small world networks, which are common in traditional societies, are a natural consequence of alternating local and global phases: new, long-distance links are formed during the global phase and existing links are reinforced (or removed) during the local phase. The advent of social media has decreased the constraining influence that space used to impose on social communication, so time has become the chief constraint for many people.

The alternation between local and global phases in social networks occurs in many different guises. Some transitions between phases occur regularly, such as the daily cycle of people moving between home and work. This alternation can influence shifts in public opinion. [4] In the absence of social interaction, the uptake of an opinion promoted by media is a Markov process. The effect of social interaction under DPE is to retard the initial uptake until the number converted reaches a critical point, after which uptake accelerates rapidly.

Socio-economics

DPE models of socio-economics interpret the economy as networks of economic agents. [5] Several studies have examined the way socioeconomics evolve when DPE acts on different parts of the network. One model [6] interpreted society as a network of occupations with inhabitants matched to those occupations. In this model social dynamics become a process of DPE within the network, with regular transitions between a development phase, during which the network settles into an equilibrium state, and a mutating phase, during which the network is transformed in random ways by the creation of new occupations.

Another model [7] interpreted growth and decline in socioeconomic activity as a conflict between cooperators and defectors. The cooperators form networks that lead to prosperity. However, the network is unstable and invasions by defectors intermittently fragment the network, reducing prosperity, until invasions of new cooperators rebuild networks again. Thus prosperity is seen as a dual phase process of alternating highly prosperous, connected phases and unprosperous, fragmented phases.

Forest ecology

In a forest, the landscape can be regarded as a network of sites where trees might grow. [8] Some sites are occupied by living trees; others sites are empty. In the local phase, sites free of trees are few and they are surrounded by forest, so the network of free sites is fragmented. In competition for these free sites, local seed sources have a massive advantage, and seeds from distant trees are virtually excluded. [1] Major fires (or other disturbances) clear away large tracts of land, so the network of free sites becomes connected and the landscape enters a global phase. In the global phase, competition for free sites is reduced, so the main competitive advantage is adaptation to the environment.

Most of the time a forest is in the local phase, as described above. The net effect is that established tree populations largely exclude invading species. [9] Even if a few isolated trees do find free ground, their population is prevented from expanding by established populations, even if the invaders are better adapted to the local environment. A fire in such conditions leads to an explosion of the invading population, and possibly to a sudden change in the character of the entire forest.

This dual phase process in the landscape explains the consist appearance of pollen zones in the postglacial forest history of North America, Europe, as well as the suppression of widespread taxa, such as beech and hemlock, followed by huge population explosions. Similar patterns, pollen zones truncated by fire-induced boundaries, have been recorded in most parts of the world

Search algorithms

Dual phase evolution is a family of search algorithms that exploit phase changes in the search space to mediate between local and global search. In this way they control the way algorithms explore a search space, so they can be regarded as a family of metaheuristic methods.

Problems such as optimization can typically be interpreted as finding the tallest peak (optimum) within a search space of possibilities. The task can be approached in two ways: local search (e.g. hill climbing) involves tracing a path from point to point, and always moving "uphill". Global search involves sampling at wide-ranging points in the search space to find high points.

Many search algorithms involve a transition between phases of global search and local search. [3] A simple example is the Great Deluge algorithm in which the searcher can move at random across the landscape, but cannot enter low-lying areas that are flooded. At first the searcher can wander freely, but rising water levels eventually confine the search to a local area. Many other nature-inspired algorithms adopt similar approaches. Simulated annealing achieves a transition between phases via its cooling schedule. The cellular genetic algorithm places solutions in a pseudo landscape in which they breed only with local neighbours. Intermittent disasters clear patches, flipping the system into a global phase until gaps are filled again.

Some variations on the memetic algorithm involve alternating between selection at different levels. These are related to the Baldwin effect, which arises when processes acting on phenotypes (e.g. learning) influence selection at the level of genotypes . In this sense, the Baldwin effect alternates between global search (genotypes) and local search (phenotypes).

Dual phase evolution is related to the well-known phenomenon of self-organized criticality (SOC). Both concern processes in which critical phase changes promote adaptation and organization within a system. However, SOC differs from DPE in several fundamental ways. [1] Under SOC, a system's natural condition is to be in a critical state; in DPE a system's natural condition is a non-critical state. In SOC the size of disturbances follows a power law; in DPE disturbances are not necessarily distributed the same way. In SOC a system is not necessarily subject to other processes; in DPE different processes (e.g. selection and variation) operate in the two phases.

Related Research Articles

<span class="mw-page-title-main">Graph theory</span> Area of discrete mathematics

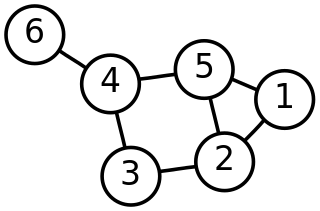
In mathematics, graph theory is the study of graphs, which are mathematical structures used to model pairwise relations between objects. A graph in this context is made up of vertices which are connected by edges. A distinction is made between undirected graphs, where edges link two vertices symmetrically, and directed graphs, where edges link two vertices asymmetrically. Graphs are one of the principal objects of study in discrete mathematics.

<span class="mw-page-title-main">Minimum spanning tree</span> Least-weight tree connecting graph vertices

A minimum spanning tree (MST) or minimum weight spanning tree is a subset of the edges of a connected, edge-weighted undirected graph that connects all the vertices together, without any cycles and with the minimum possible total edge weight. That is, it is a spanning tree whose sum of edge weights is as small as possible. More generally, any edge-weighted undirected graph has a minimum spanning forest, which is a union of the minimum spanning trees for its connected components.

<span class="mw-page-title-main">Shortest path problem</span> Computational problem of graph theory

In graph theory, the shortest path problem is the problem of finding a path between two vertices in a graph such that the sum of the weights of its constituent edges is minimized.

A* is a graph traversal and path search algorithm, which is used in many fields of computer science due to its completeness, optimality, and optimal efficiency. One major practical drawback is its space complexity, as it stores all generated nodes in memory. Thus, in practical travel-routing systems, it is generally outperformed by algorithms which can pre-process the graph to attain better performance, as well as memory-bounded approaches; however, A* is still the best solution in many cases.

A Bayesian network is a probabilistic graphical model that represents a set of variables and their conditional dependencies via a directed acyclic graph (DAG). Bayesian networks are ideal for taking an event that occurred and predicting the likelihood that any one of several possible known causes was the contributing factor. For example, a Bayesian network could represent the probabilistic relationships between diseases and symptoms. Given symptoms, the network can be used to compute the probabilities of the presence of various diseases.

<span class="mw-page-title-main">Hypergraph</span> Generalization of graph theory

In mathematics, a hypergraph is a generalization of a graph in which an edge can join any number of vertices. In contrast, in an ordinary graph, an edge connects exactly two vertices.

<span class="mw-page-title-main">Force-directed graph drawing</span> Physical simulation to visualize graphs

Force-directed graph drawing algorithms are a class of algorithms for drawing graphs in an aesthetically-pleasing way. Their purpose is to position the nodes of a graph in two-dimensional or three-dimensional space so that all the edges are of more or less equal length and there are as few crossing edges as possible, by assigning forces among the set of edges and the set of nodes, based on their relative positions, and then using these forces either to simulate the motion of the edges and nodes or to minimize their energy.

In computer science, a topological sort or topological ordering of a directed graph is a linear ordering of its vertices such that for every directed edge uv from vertex u to vertex v, u comes before v in the ordering. For instance, the vertices of the graph may represent tasks to be performed, and the edges may represent constraints that one task must be performed before another; in this application, a topological ordering is just a valid sequence for the tasks. Precisely, a topological sort is a graph traversal in which each node v is visited only after all its dependencies are visited. A topological ordering is possible if and only if the graph has no directed cycles, that is, if it is a directed acyclic graph (DAG). Any DAG has at least one topological ordering, and algorithms are known for constructing a topological ordering of any DAG in linear time. Topological sorting has many applications especially in ranking problems such as feedback arc set. Topological sorting is possible even when the DAG has disconnected components.

<span class="mw-page-title-main">Small-world network</span> Graph where most nodes are reachable in a small number of steps

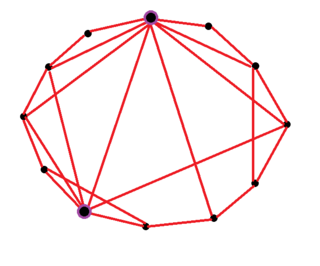
A small-world network is a type of mathematical graph in which most nodes are not neighbors of one another, but the neighbors of any given node are likely to be neighbors of each other and most nodes can be reached from every other node by a small number of hops or steps. Specifically, a small-world network is defined to be a network where the typical distance L between two randomly chosen nodes grows proportionally to the logarithm of the number of nodes N in the network, that is:

<span class="mw-page-title-main">Centrality</span> Degree of connectedness within a graph

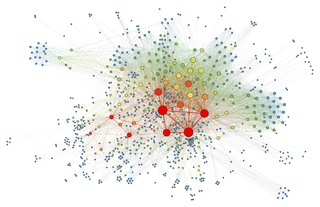
In graph theory and network analysis, indicators of centrality assign numbers or rankings to nodes within a graph corresponding to their network position. Applications include identifying the most influential person(s) in a social network, key infrastructure nodes in the Internet or urban networks, super-spreaders of disease, and brain networks. Centrality concepts were first developed in social network analysis, and many of the terms used to measure centrality reflect their sociological origin.

<span class="mw-page-title-main">Giant component</span> Large connected component of a random graph

In network theory, a giant component is a connected component of a given random graph that contains a finite fraction of the entire graph's vertices.

<span class="mw-page-title-main">Community structure</span> Concept in graph theory

In the study of complex networks, a network is said to have community structure if the nodes of the network can be easily grouped into sets of nodes such that each set of nodes is densely connected internally. In the particular case of non-overlapping community finding, this implies that the network divides naturally into groups of nodes with dense connections internally and sparser connections between groups. But overlapping communities are also allowed. The more general definition is based on the principle that pairs of nodes are more likely to be connected if they are both members of the same community(ies), and less likely to be connected if they do not share communities. A related but different problem is community search, where the goal is to find a community that a certain vertex belongs to.

In distributed computing, leader election is the process of designating a single process as the organizer of some task distributed among several computers (nodes). Before the task has begun, all network nodes are either unaware which node will serve as the "leader" of the task, or unable to communicate with the current coordinator. After a leader election algorithm has been run, however, each node throughout the network recognizes a particular, unique node as the task leader.

<span class="mw-page-title-main">Random geometric graph</span> In graph theory, the mathematically simplest spatial network

In graph theory, a random geometric graph (RGG) is the mathematically simplest spatial network, namely an undirected graph constructed by randomly placing N nodes in some metric space and connecting two nodes by a link if and only if their distance is in a given range, e.g. smaller than a certain neighborhood radius, r.

An important question in statistical mechanics is the dependence of model behaviour on the dimension of the system. The shortcut model was introduced in the course of studying this dependence. The model interpolates between discrete regular lattices of integer dimension.

<span class="mw-page-title-main">Network science</span> Academic field

Network science is an academic field which studies complex networks such as telecommunication networks, computer networks, biological networks, cognitive and semantic networks, and social networks, considering distinct elements or actors represented by nodes and the connections between the elements or actors as links. The field draws on theories and methods including graph theory from mathematics, statistical mechanics from physics, data mining and information visualization from computer science, inferential modeling from statistics, and social structure from sociology. The United States National Research Council defines network science as "the study of network representations of physical, biological, and social phenomena leading to predictive models of these phenomena."

<span class="mw-page-title-main">Closeness centrality</span>

In a connected graph, closeness centrality of a node is a measure of centrality in a network, calculated as the reciprocal of the sum of the length of the shortest paths between the node and all other nodes in the graph. Thus, the more central a node is, the closer it is to all other nodes.

In computer science, the method of contraction hierarchies is a speed-up technique for finding the shortest-path in a graph. The most intuitive applications are car-navigation systems: a user wants to drive from to using the quickest possible route. The metric optimized here is the travel time. Intersections are represented by vertices, the road sections connecting them by edges. The edge weights represent the time it takes to drive along this segment of the road. A path from to is a sequence of edges ; the shortest path is the one with the minimal sum of edge weights among all possible paths. The shortest path in a graph can be computed using Dijkstra's algorithm but, given that road networks consist of tens of millions of vertices, this is impractical. Contraction hierarchies is a speed-up method optimized to exploit properties of graphs representing road networks. The speed-up is achieved by creating shortcuts in a preprocessing phase which are then used during a shortest-path query to skip over "unimportant" vertices. This is based on the observation that road networks are highly hierarchical. Some intersections, for example highway junctions, are "more important" and higher up in the hierarchy than for example a junction leading into a dead end. Shortcuts can be used to save the precomputed distance between two important junctions such that the algorithm doesn't have to consider the full path between these junctions at query time. Contraction hierarchies do not know about which roads humans consider "important", but they are provided with the graph as input and are able to assign importance to vertices using heuristics.

<span class="mw-page-title-main">Louvain method</span> Clustering and community detection algorithm

The Louvain method for community detection is a method to extract communities from large networks created by Blondel et al. from the University of Louvain. The method is a greedy optimization method that appears to run in time where is the number of nodes in the network.

<span class="mw-page-title-main">Stoer–Wagner algorithm</span>

In graph theory, the Stoer–Wagner algorithm is a recursive algorithm to solve the minimum cut problem in undirected weighted graphs with non-negative weights. It was proposed by Mechthild Stoer and Frank Wagner in 1995. The essential idea of this algorithm is to shrink the graph by merging the most intensive vertices, until the graph only contains two combined vertex sets. At each phase, the algorithm finds the minimum - cut for two vertices and chosen at its will. Then the algorithm shrinks the edge between and to search for non - cuts. The minimum cut found in all phases will be the minimum weighted cut of the graph.

References

  1. 1 2 3 4 5 Green, D.G.; Liu, J. & Abbass, H. (2014). Dual Phase Evolution: from Theory to Practice. Berlin: Springer. ISBN   978-1441984227.
  2. 1 2 Erdős, P. & Rényi, A. (1960). "On the evolution of random graphs" (PDF). Publications of the Mathematical Institute of the Hungarian Academy of Sciences. 5: 17–61.
  3. 1 2 3 Paperin, G.; Green, D.G. & Sadedin, S. (2011). "Dual Phase Evolution in Complex Adaptive Systems". Journal of the Royal Society Interface. 8 (58): 609–629. doi:10.1098/rsif.2010.0719. PMC   3061102 . PMID   21247947.
  4. Stocker, R.; Cornforth, D. & Green, D.G. (2003). "A simulation of the impact of media on social cohesion". Advances in Complex Systems. 6 (3): 349–359. doi:10.1142/S0219525903000931.
  5. Goodman, J. (2014). "Evidence for ecological learning and domain specificity in rational asset pricing and market efficiency" (PDF). The Journal of Socio-Economics. 48: 27–39. doi:10.1016/j.socec.2013.10.002.
  6. Xu, G.; Yang, J. & Li, G. (2013). "Simulating society transitions: standstill, collapse and growth in an evolving network model". PLOS ONE. 8 (9): e75433. Bibcode:2013PLoSO...875433X. doi: 10.1371/journal.pone.0075433 . PMC   3783390 . PMID   24086530.
  7. Cavaliere, M.; Sedwards, C.; Tarnita, C.E.; Nowak, M.A. & Csikász-Nagy, A. (2012). "Prosperity is associated with instability in dynamical networks". Journal of Theoretical Biology. 299: 126–138. arXiv: 1102.4947 . Bibcode:2012JThBi.299..126C. doi:10.1016/j.jtbi.2011.09.005. PMC   3298632 . PMID   21983567.
  8. Green, David G. (1994). "Connectivity and complexity in ecological systems". Pacific Conservation Biology. 1 (3): 194–200. doi:10.1071/PC940194.
  9. Green, David G (1982). "Fire and stability in the postglacial forests of southwest Nova Scotia". Journal of Biogeography. 9 (1): 29–40. doi:10.2307/2844728. JSTOR   2844728.