Related Research Articles
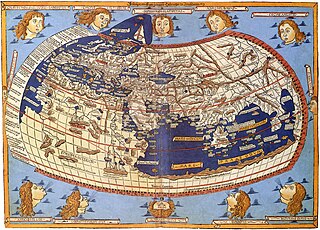
Cartography is the study and practice of making and using maps. Combining science, aesthetics and technique, cartography builds on the premise that reality can be modeled in ways that communicate spatial information effectively.
A geographic information system (GIS) is a type of database containing geographic data, combined with software tools for managing, analyzing, and visualizing those data. In a broader sense, one may consider such a system to also include human users and support staff, procedures and workflows, body of knowledge of relevant concepts and methods, and institutional organizations.

A map is a symbolic depiction emphasizing relationships between elements of some space, such as objects, regions, or themes.
An orthophoto, orthophotograph, orthoimage or orthoimagery is an aerial photograph or satellite imagery geometrically corrected ("orthorectified") such that the scale is uniform: the photo or image follows a given map projection. Unlike an uncorrected aerial photograph, an orthophoto can be used to measure true distances, because it is an accurate representation of the Earth's surface, having been adjusted for topographic relief, lens distortion, and camera tilt.
A GIS software program is a computer program to support the use of a geographic information system, providing the ability to create, store, manage, query, analyze, and visualize geographic data, that is, data representing phenomena for which location is important. The GIS software industry encompasses a broad range of commercial and open-source products that provide some or all of these capabilities within various information technology architectures.

David Rumsey is an American map collector and the founder of the David Rumsey Map Collection. He is also the president of Cartography Associates.

A thematic map is a type of map that portrays the geographic pattern of a particular subject matter (theme) in a geographic area. This usually involves the use of map symbols to visualize selected properties of geographic features that are not naturally visible, such as temperature, language, or population. In this, they contrast with general reference maps, which focus on the location of a diverse set of physical features, such as rivers, roads, and buildings. Alternative names have been suggested for this class, such as special-subject or special-purpose maps, statistical maps, or distribution maps, but these have generally fallen out of common usage. Thematic mapping is closely allied with the field of Geovisualization.
The Open Source Geospatial Foundation (OSGeo), is a non-profit non-governmental organization whose mission is to support and promote the collaborative development of open geospatial technologies and data. The foundation was formed in February 2006 to provide financial, organizational and legal support to the broader Free and open-source geospatial community. It also serves as an independent legal entity to which community members can contribute code, funding and other resources.
East View Geospatial (EVG), formerly East View Cartographic (EVC), is a provider of worldwide maps, geospatial data and geographic information systems (GIS) services. EVG's holdings include all types of geospatial data including vector & raster data, digital elevation models (DEM), satellite & aerial imagery, topographic maps, nautical & aeronautical charts, geological maps, bathymetric data and atlases.

Pictorial maps depict a given territory with a more artistic rather than technical style. It is a type of map in contrast to road map, atlas, or topographic map. The cartography can be a sophisticated 3-D perspective landscape or a simple map graphic enlivened with illustrations of buildings, people and animals. They can feature all sorts of varied topics like historical events, legendary figures or local agricultural products and cover anything from an entire continent to a college campus. Drawn by specialized artists and illustrators, pictorial maps are a rich, centuries-old tradition and a diverse art form that ranges from cartoon maps on restaurant placemats to treasured art prints in museums.

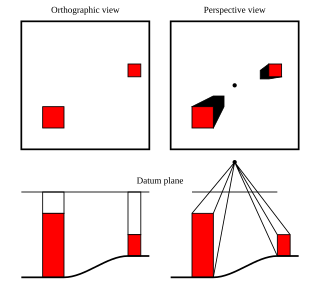
Terrain cartography or relief mapping is the depiction of the shape of the surface of the Earth on a map, using one or more of several techniques that have been developed. Terrain or relief is an essential aspect of physical geography, and as such its portrayal presents a central problem in cartographic design, and more recently geographic information systems and geovisualization.

A Web mapping or an online mapping is the process of using the maps delivered by geographic information systems (GIS) on the Internet, more specifically in the World Wide Web (WWW). A web map or an online map is both served and consumed, thus web mapping is more than just web cartography, it is a service by which consumers may choose what the map will show. Web GIS emphasizes geodata processing aspects more involved with design aspects such as data acquisition and server software architecture such as data storage and algorithms, than it does the end-user reports themselves.
A historical geographic information system is a geographic information system that may display, store and analyze data of past geographies and track changes in time. It can be regarded as a tool for historical geography.
The Great Britain Historical GIS, is a spatially enabled database that documents and visualises the changing human geography of the British Isles, although is primarily focussed on the subdivisions of the United Kingdom mainly over the 200 years since the first census in 1801. The project is currently based at the University of Portsmouth, and is the provider of the website A Vision of Britain through Time.
Traditional knowledge geographic information systems (GIS) are the data, techniques, and technologies designed to document and utilize local knowledges in communities around the world. Traditional knowledge is information that encompasses the experiences of a particular culture or society. Traditional knowledge GIS are more valuable than ordinary cognitive maps in that they express environmental and spiritual relationships among real and conceptual entities. They comprise a formidable toolset for use in cultural preservation, land rights disputes, natural resource management, and economic development.
Critical cartography is a set of mapping practices and methods of analysis grounded in critical theory, specifically the thesis that maps reflect and perpetuate relations of power, typically in favor of a society's dominant group. Critical cartographers aim to reveal the “‘hidden agendas of cartography’ as tools of socio-spatial power”. While the term "critical cartography" often refers to a body of theoretical literature, critical cartographers also call for practical applications of critical cartographic theory, such as counter-mapping, participatory mapping, and neogeography.
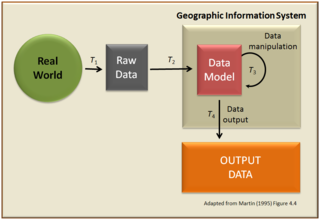
A geographic data model, geospatial data model, or simply data model in the context of geographic information systems, is a mathematical and digital structure for representing phenomena over the Earth. Generally, such data models represent various aspects of these phenomena by means of geographic data, including spatial locations, attributes, change over time, and identity. For example, the vector data model represents geography as collections of points, lines, and polygons, and the raster data model represent geography as cell matrices that store numeric values. Data models are implemented throughout the GIS ecosystem, including the software tools for data management and spatial analysis, data stored in a variety of GIS file formats, specifications and standards, and specific designs for GIS installations.

Geography is a field of science devoted to the study of the lands, features, inhabitants, and phenomena of the Earth and planets. The first person to use the word γεωγραφία was Eratosthenes. Geography is an all-encompassing discipline that seeks an understanding of Earth and its human and natural complexities—not merely where objects are, but also how they have changed and come to be.
Geographic information systems (GIS) play a constantly evolving role in geospatial intelligence (GEOINT) and United States national security. These technologies allow a user to efficiently manage, analyze, and produce geospatial data, to combine GEOINT with other forms of intelligence collection, and to perform highly developed analysis and visual production of geospatial data. Therefore, GIS produces up-to-date and more reliable GEOINT to reduce uncertainty for a decisionmaker. Since GIS programs are Web-enabled, a user can constantly work with a decision maker to solve their GEOINT and national security related problems from anywhere in the world. There are many types of GIS software used in GEOINT and national security, such as Google Earth, ERDAS IMAGINE, GeoNetwork opensource, and Esri ArcGIS.
Cynthia A. Brewer is an American professor of geography at the Pennsylvania State University, Pennsylvania, and author. She has worked as a map and atlas design consultant for the U.S. Census Bureau, National Cancer Institute, National Center for Health Statistics, and National Park Service. She teaches the introductory cartography and map design courses. Her specialism relates to visibility and color theory in cartography. She also works on topographic map design, multi-scale mapping, generalization, atlas mapping. She has been influential as a theorist for map representations and influences GIS professionals.
References
- ↑ Polo, Juan Diego. "Euratlas, mapas históricos de Europa en formato digital". WWWhat's new? - Aplicaciones, marketing y noticias en la web. Retrieved 2017-01-21.
- ↑ Jones, Charles (2010-12-21). "AWOL - The Ancient World Online: EurAtlas". AWOL - The Ancient World Online. Retrieved 2017-01-21.
- ↑ "Stanford University EarthWorks. Autonomous Peoples, Europe, Year 100". earthworks.stanford.edu. Retrieved 2017-01-21.
- ↑ Euratlas. "Euratlas Web FAQ". www.euratlas.net. Retrieved 2017-01-21.
- ↑ "University of Virginia Library Research | Data Services + Sciences". data.library.virginia.edu. Retrieved 2017-01-21.
- ↑ "- Portal de Educación de la Junta de Castilla y León - Euratlas". www.educa.jcyl.es (in Spanish). Retrieved 2017-01-21.
- ↑ Gibbs, Patrick (2011-09-01). "Nüssli Marc-Antoine & Nüssli Christos . Euratlas Periodis Expert: periodical historical atlas of Europe 1–2000 (digital cartography program). Program on CD". Antiquity. 85 (329): 1101–1102. doi:10.1017/S0003598X0006868X. ISSN 0003-598X.
- ↑ "The AU Library Knowledgebase (Washington). Does the library have access to ..." answers.library.american.edu. Archived from the original on 2017-02-02. Retrieved 2017-01-21.
- ↑ COURTOIS, Christophe. "Euratlas". www.coindeweb.net (in French). Retrieved 2017-01-21.
- ↑ "Duke University Libraries | Euratlas Historical Vector Data". library.duke.edu. Retrieved 2017-01-21.
- ↑ Euratlas. "And the GIS Data? Marc-Antonie Nüssli". www.euratlas.net. Retrieved 2017-01-21.